6 minutes
Tracking
Quickly see top companies by opportunities and by student engagement, check out the ratio of paid vs unpaid opportunities, see at-a-glance which stage status requests are at, and which career clusters have the most opportunities available. Having these quick views of the data makes it easier to see trends:
- Track any gaps: Spot pipeline bottlenecks immediately using the Requests by status chart to see where students might be getting stuck in the application or placement process.
- Diversify opportunities: Quickly view how much variety is in the Opportunities by career cluster report to ensure well-rounded student options
- Gauge student demand: Compare what is being offered against real student interests using the Opportunity type by student engagement chart to ensure future placements align with student goals.
- Evaluate employer participation: Contrast the companies hosting the most opportunities against those driving the highest student interest to see which business relationships are thriving and which need a boost.
Access the reports
Use these reports and key metrics to get a clear, visual update on your
From your educator account, click Reports and select
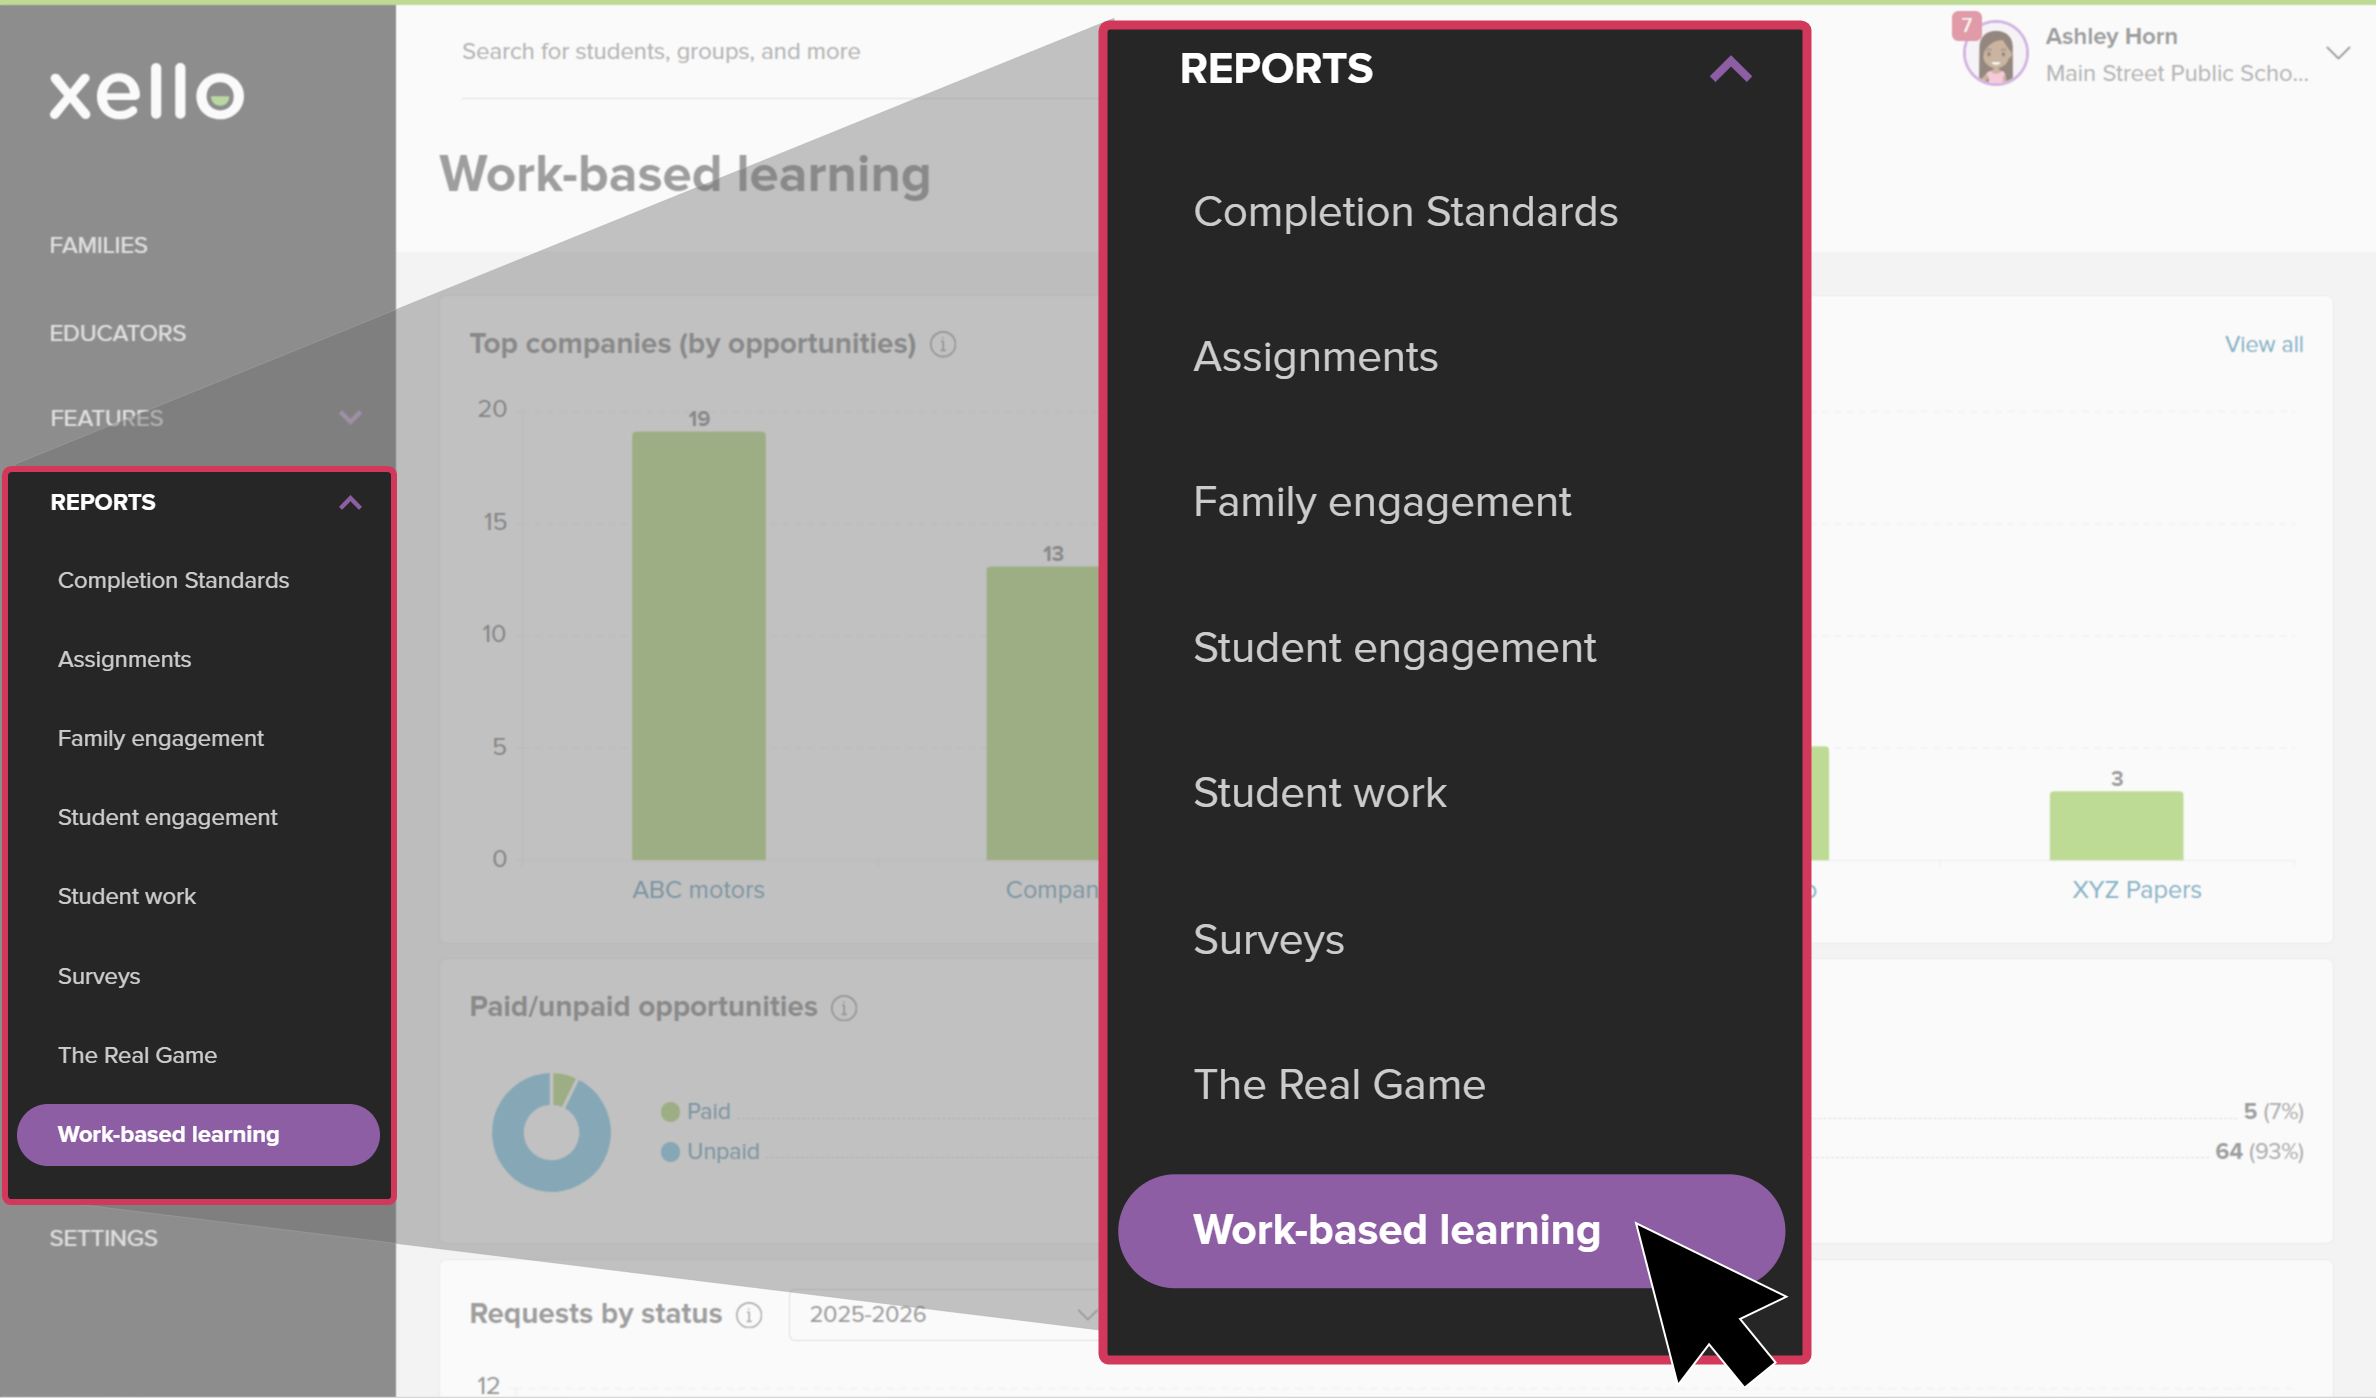
Alternatively, while you're on the
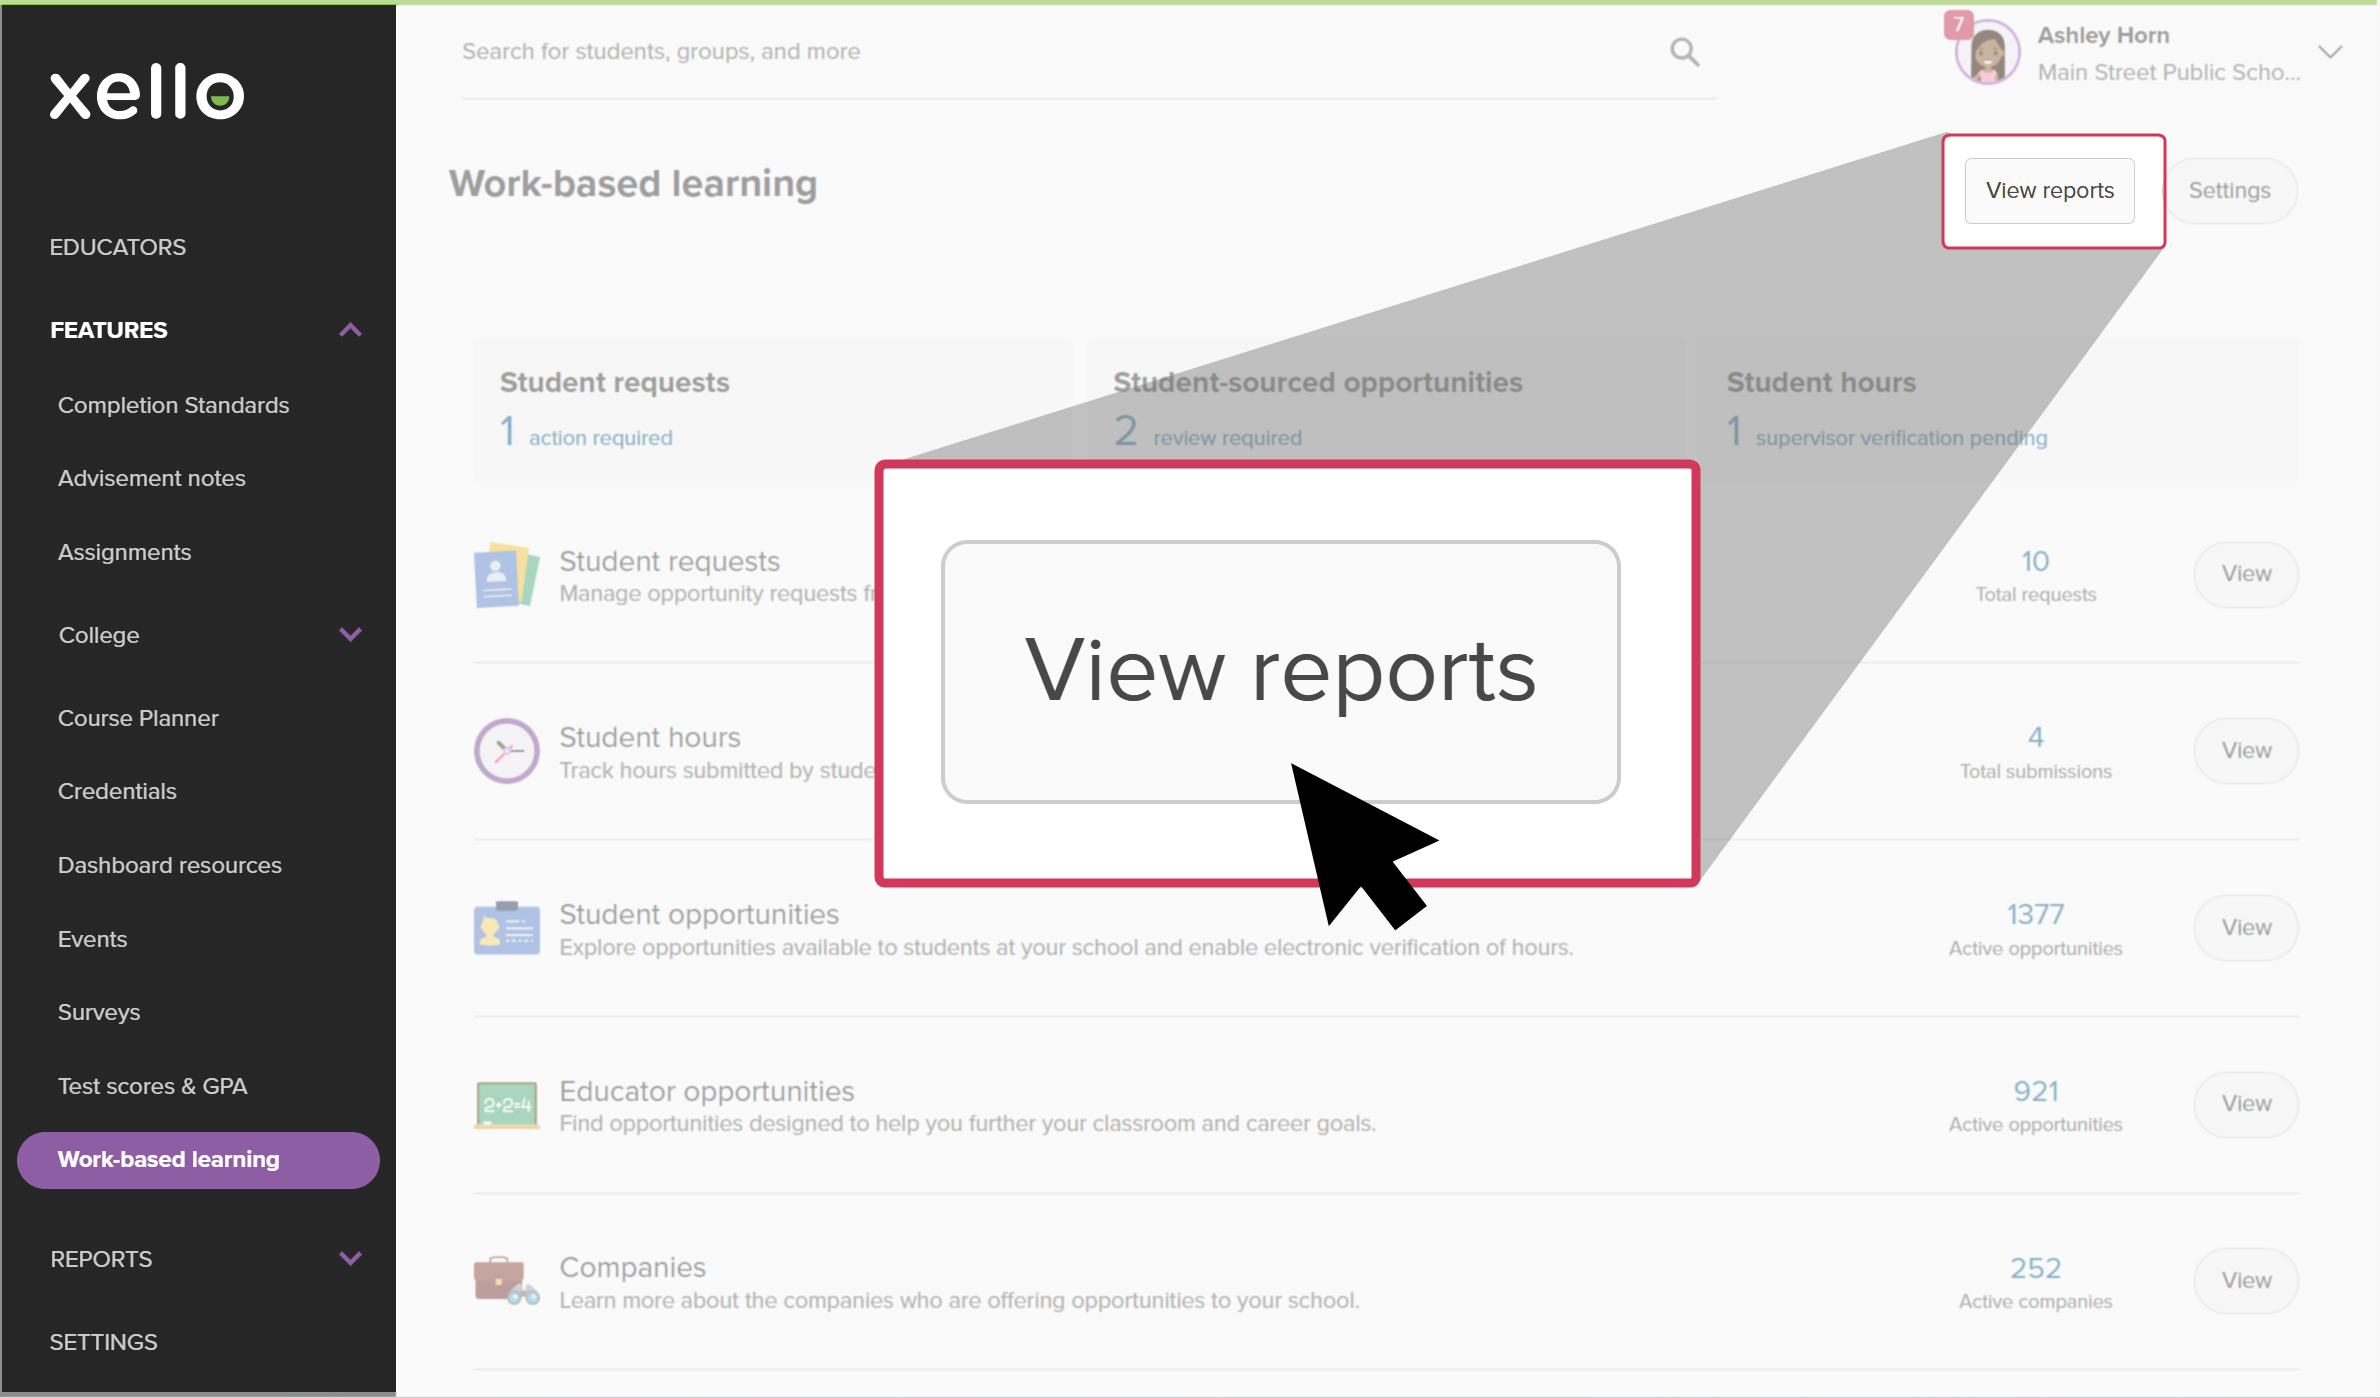
Types of reports
The
-
- Engagement Metrics: These track how students interact with those opportunities, such as which companies are most popular, student demographics, and where requests are in the application pipeline.
The full list of
| Report | Data definition |
|---|---|
|
Top companies (by opportunities) |
The data shows the top 5 companies by number of opportunities available to students in your organization. |
| Paid/unpaid opportunities | The data shows the total number of opportunities by compensation status available to students in your organization. |
| Requests by status | The data shows request counts by status for the selected academic year. Excludes declined and pending requests for student-sourced opportunities. |
| Top opportunity types (by volume) |
The data shows the top opportunity types based on the number available to students in your organization. |
| Top opportunity types (by student engagement) | The data shows the most popular opportunity types based on active student engagement. |
| Top companies (by student engagement) | The data shows the most popular companies based on active student engagement. |
| Opportunities by career cluster |
The data shows the distribution of opportunities available to students in your organization by career cluster. |
| Top sites (by student engagement) | The data shows the top sites based on student engagement. |
|
Requests by grade |
The data shows request counts by grade for the selected academic year. Excludes declined and pending requests for student-sourced opportunities. |
Work with the reports
Every chart and list on your
Dashboard view
Once on the
Every chart and list card on the dashboard is interactive, acting as a direct gateway to deeper data insights. You can click on different parts to gain more valuable insight:
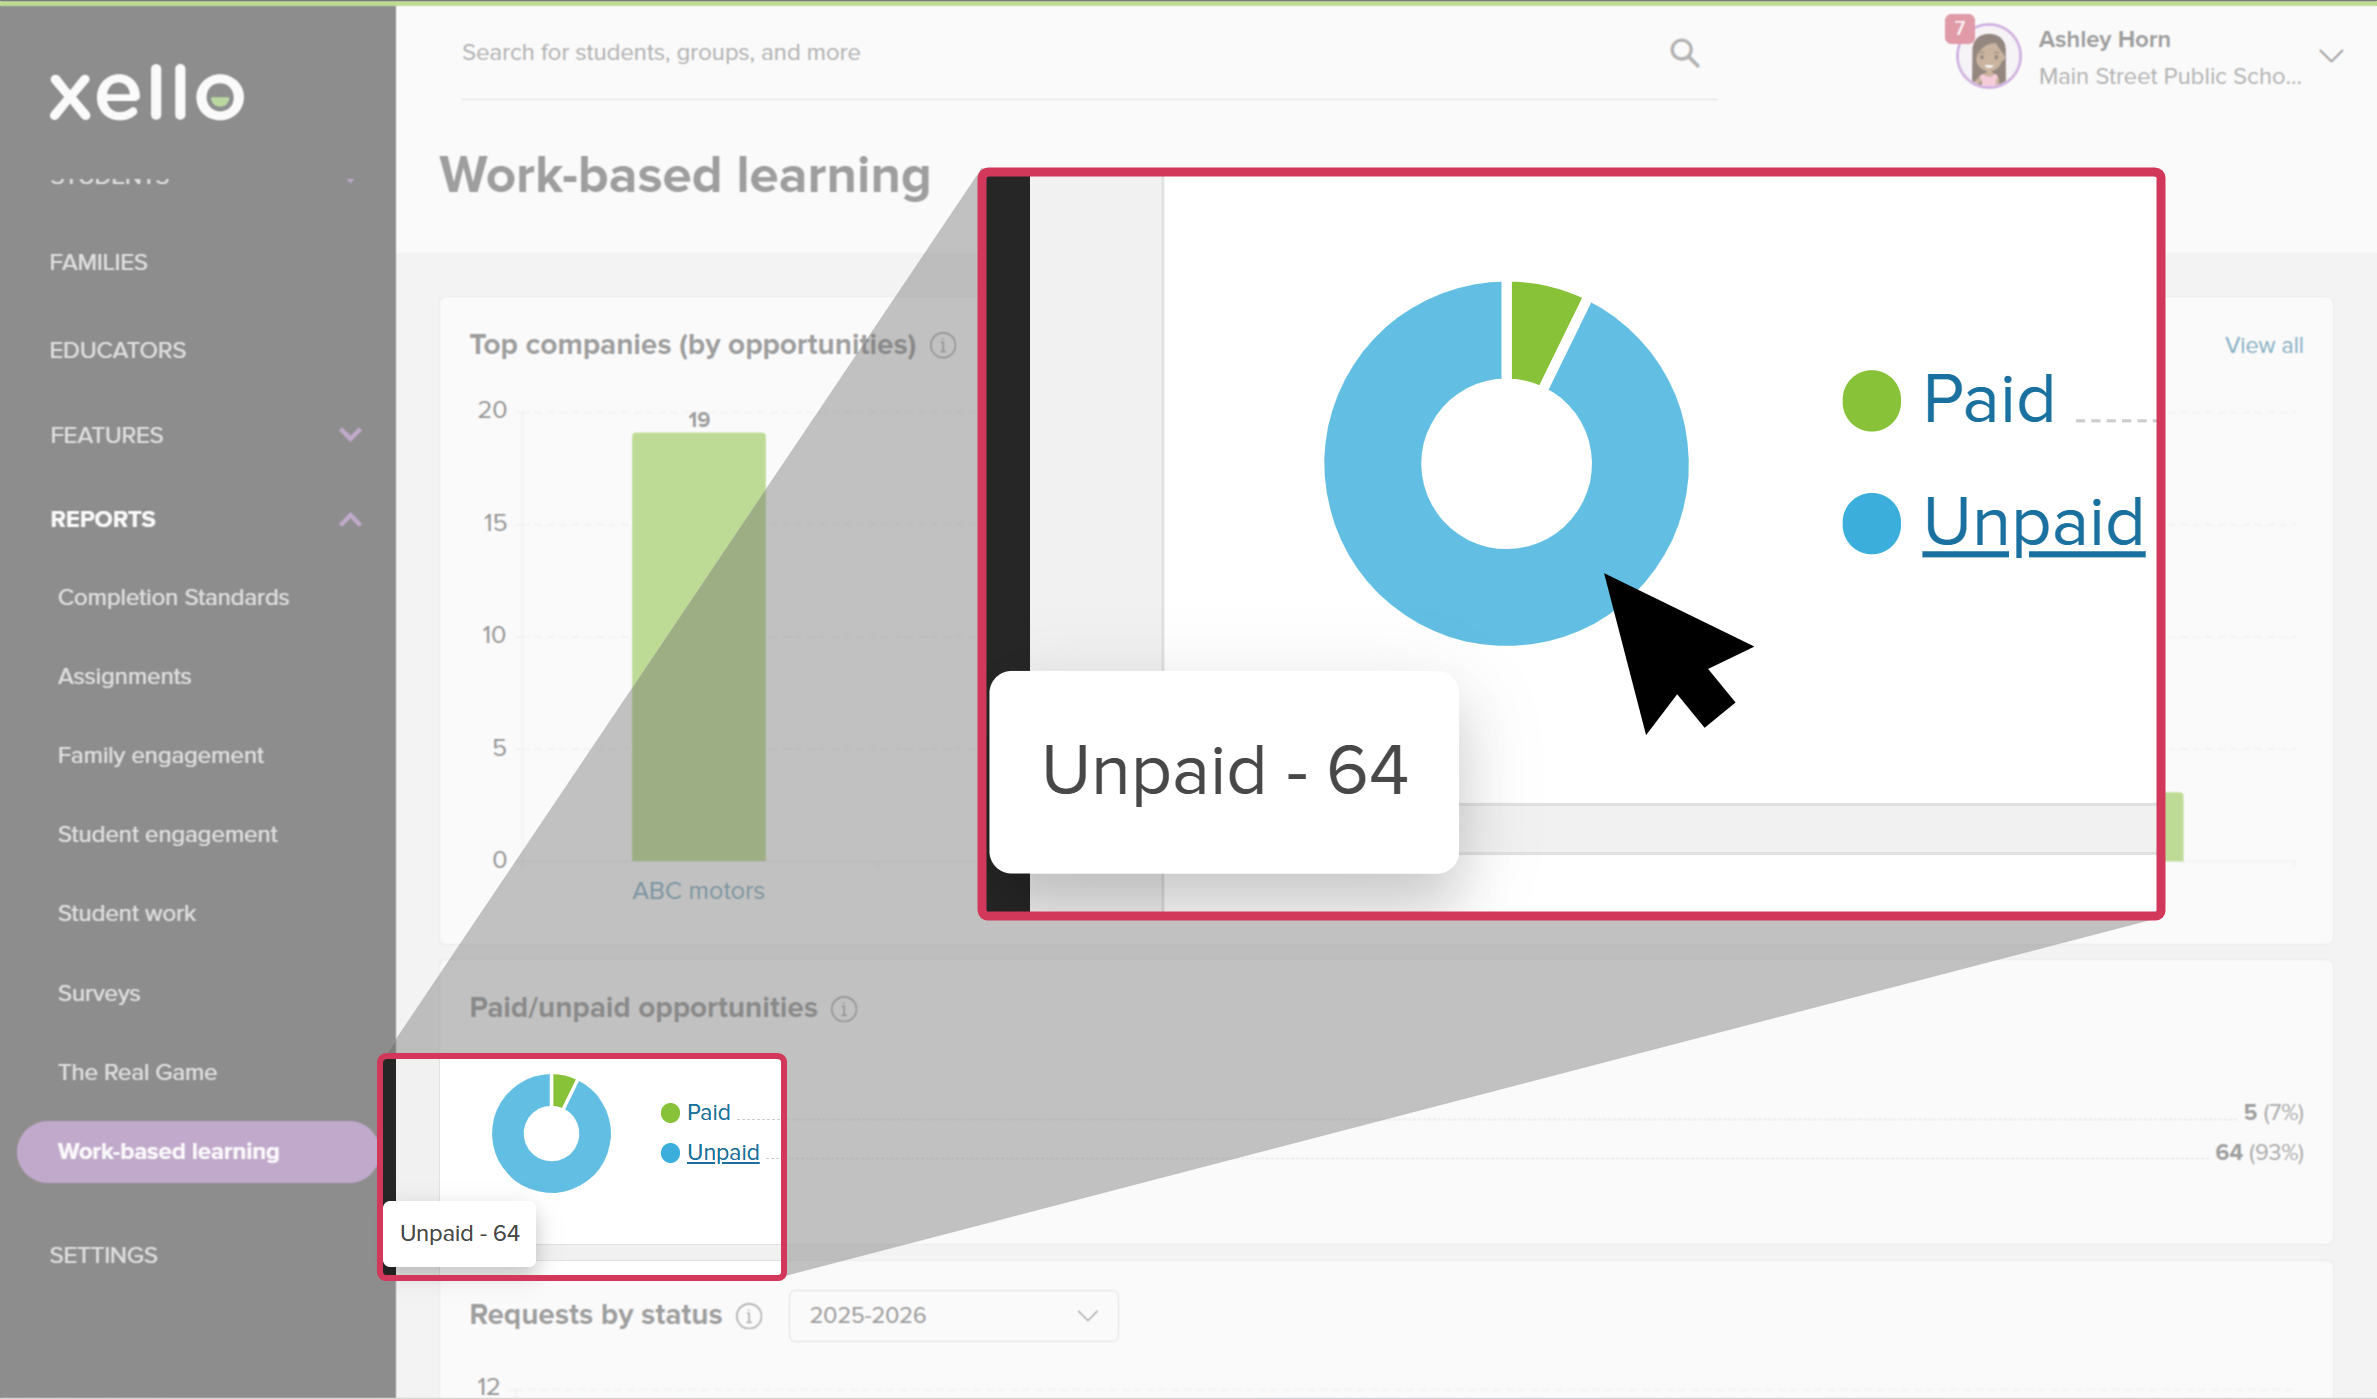
- Clicking directly on a visual part of a chart (like a bar on a graph or a slice of a pie chart) opens a table view filtered by the data you clicked. For example, clicking the Unpaid slice pulls up a table of only unpaid opportunities.
 Click to enlarge
- For cards that show text lists (like Top companies), clicking a the data list name takes you straight to a data table filtered for that data point you clicked.
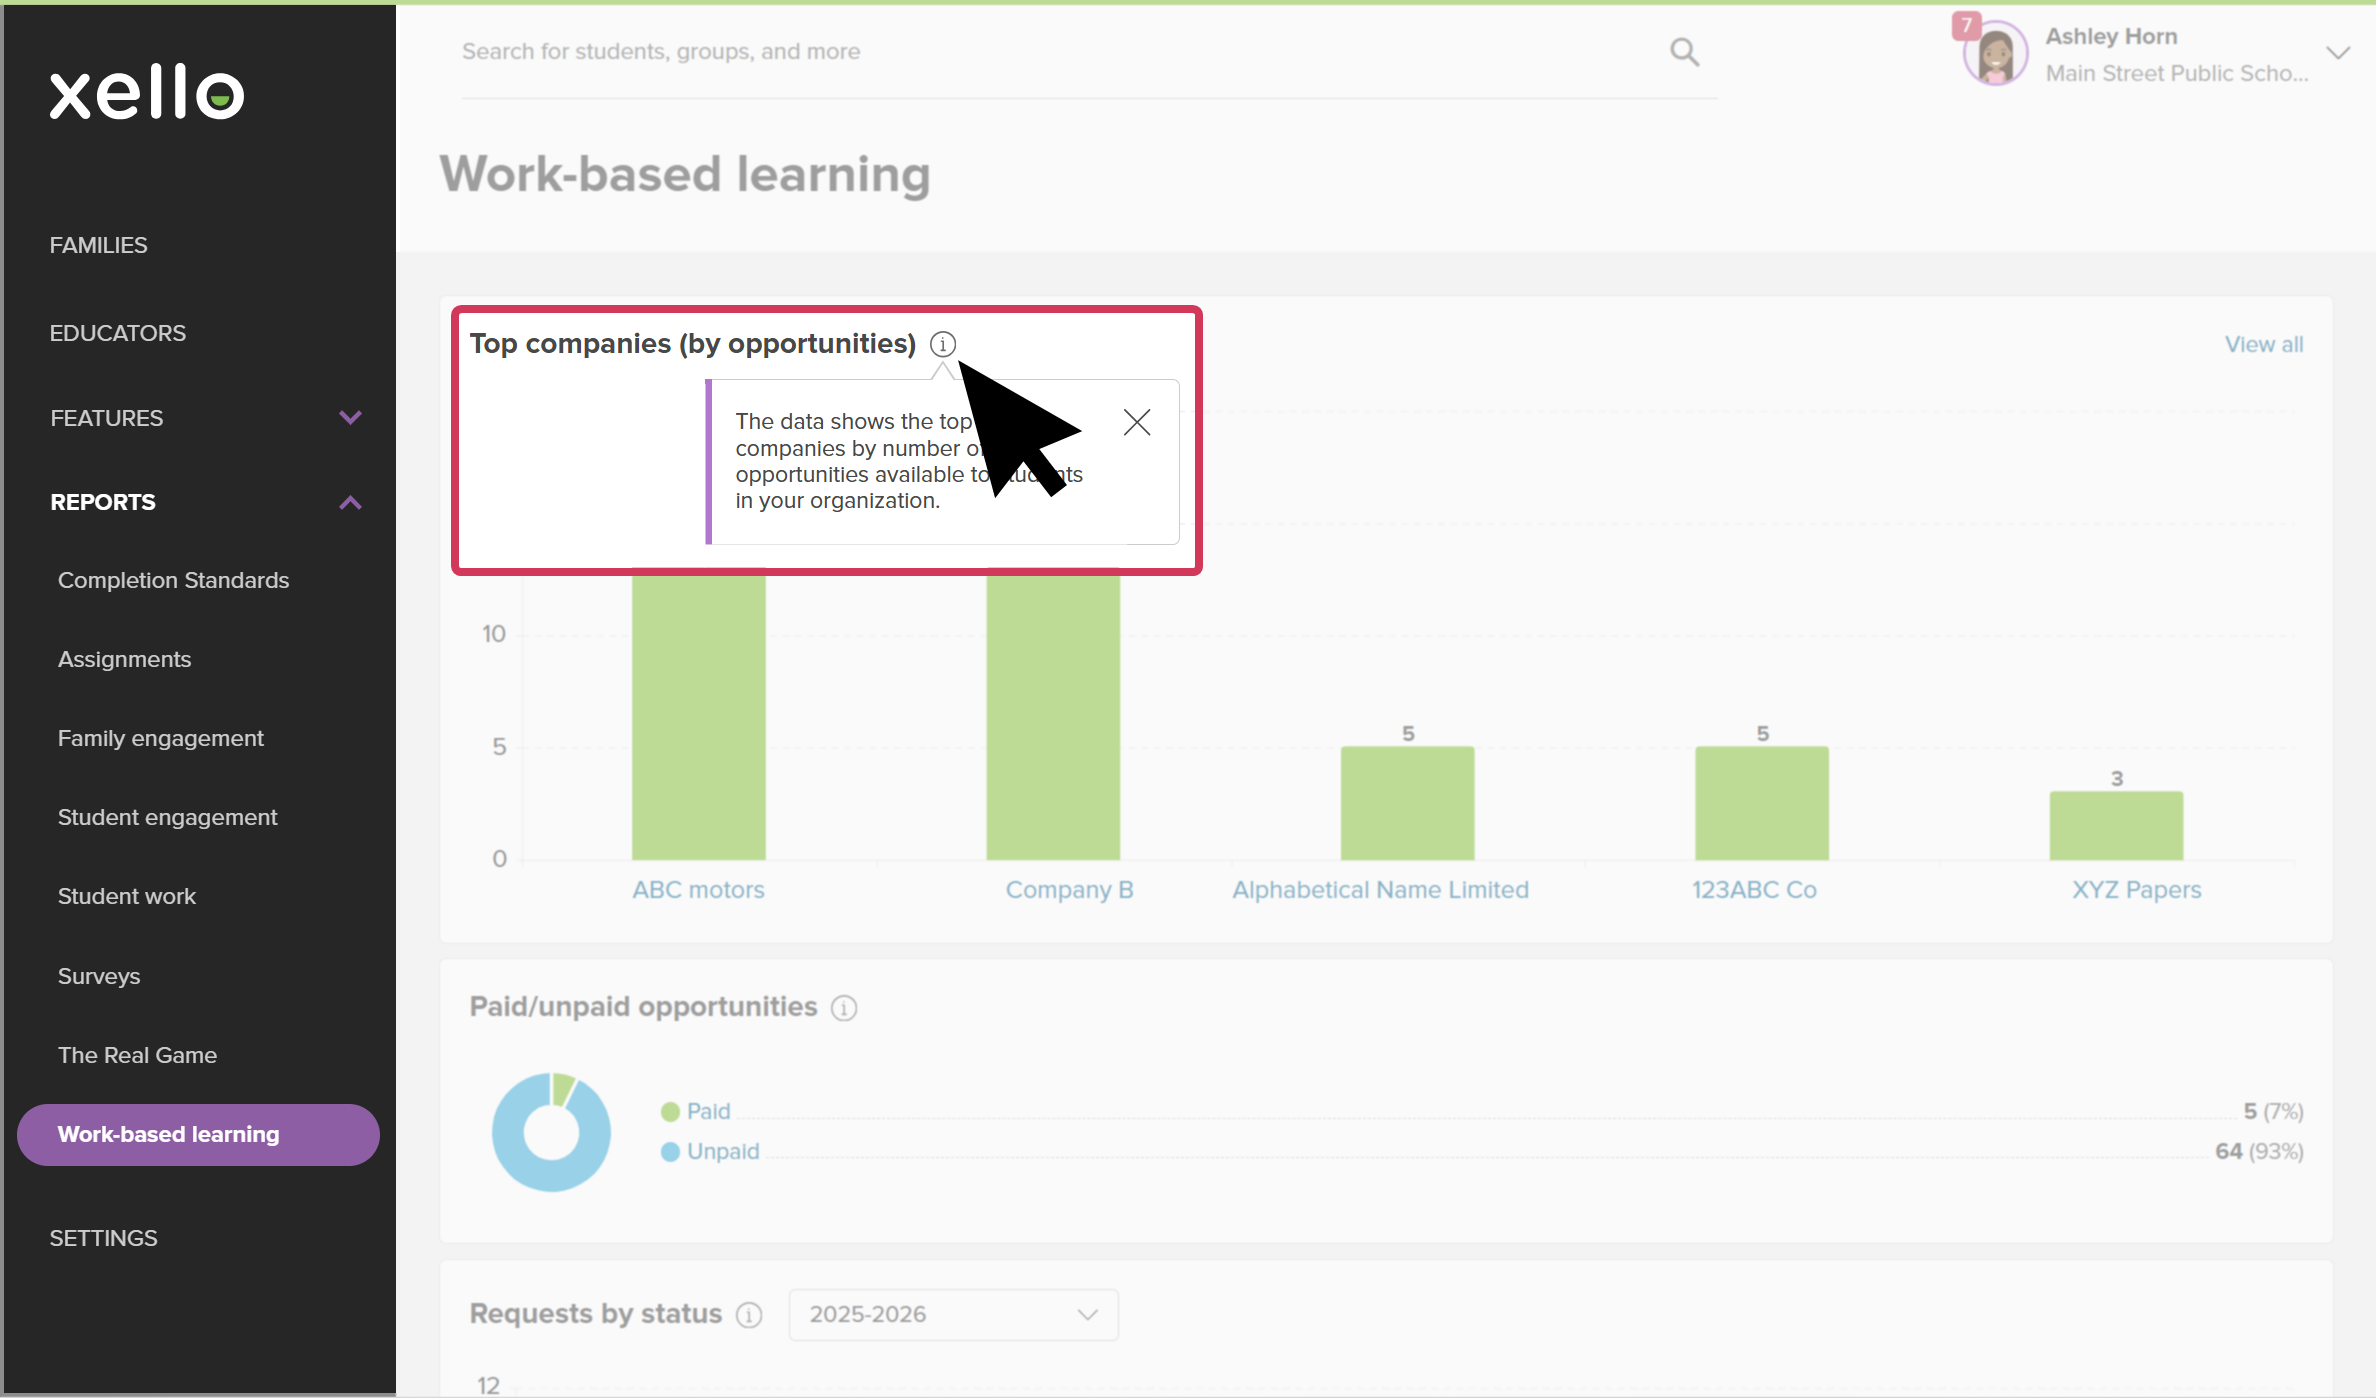
- Every card has an information icon
 . Click it to see a quick description explaining what that data shows.
 Click to enlarge
- The View all link at the top right of a card takes you directly to the full, unfiltered data table for that category.
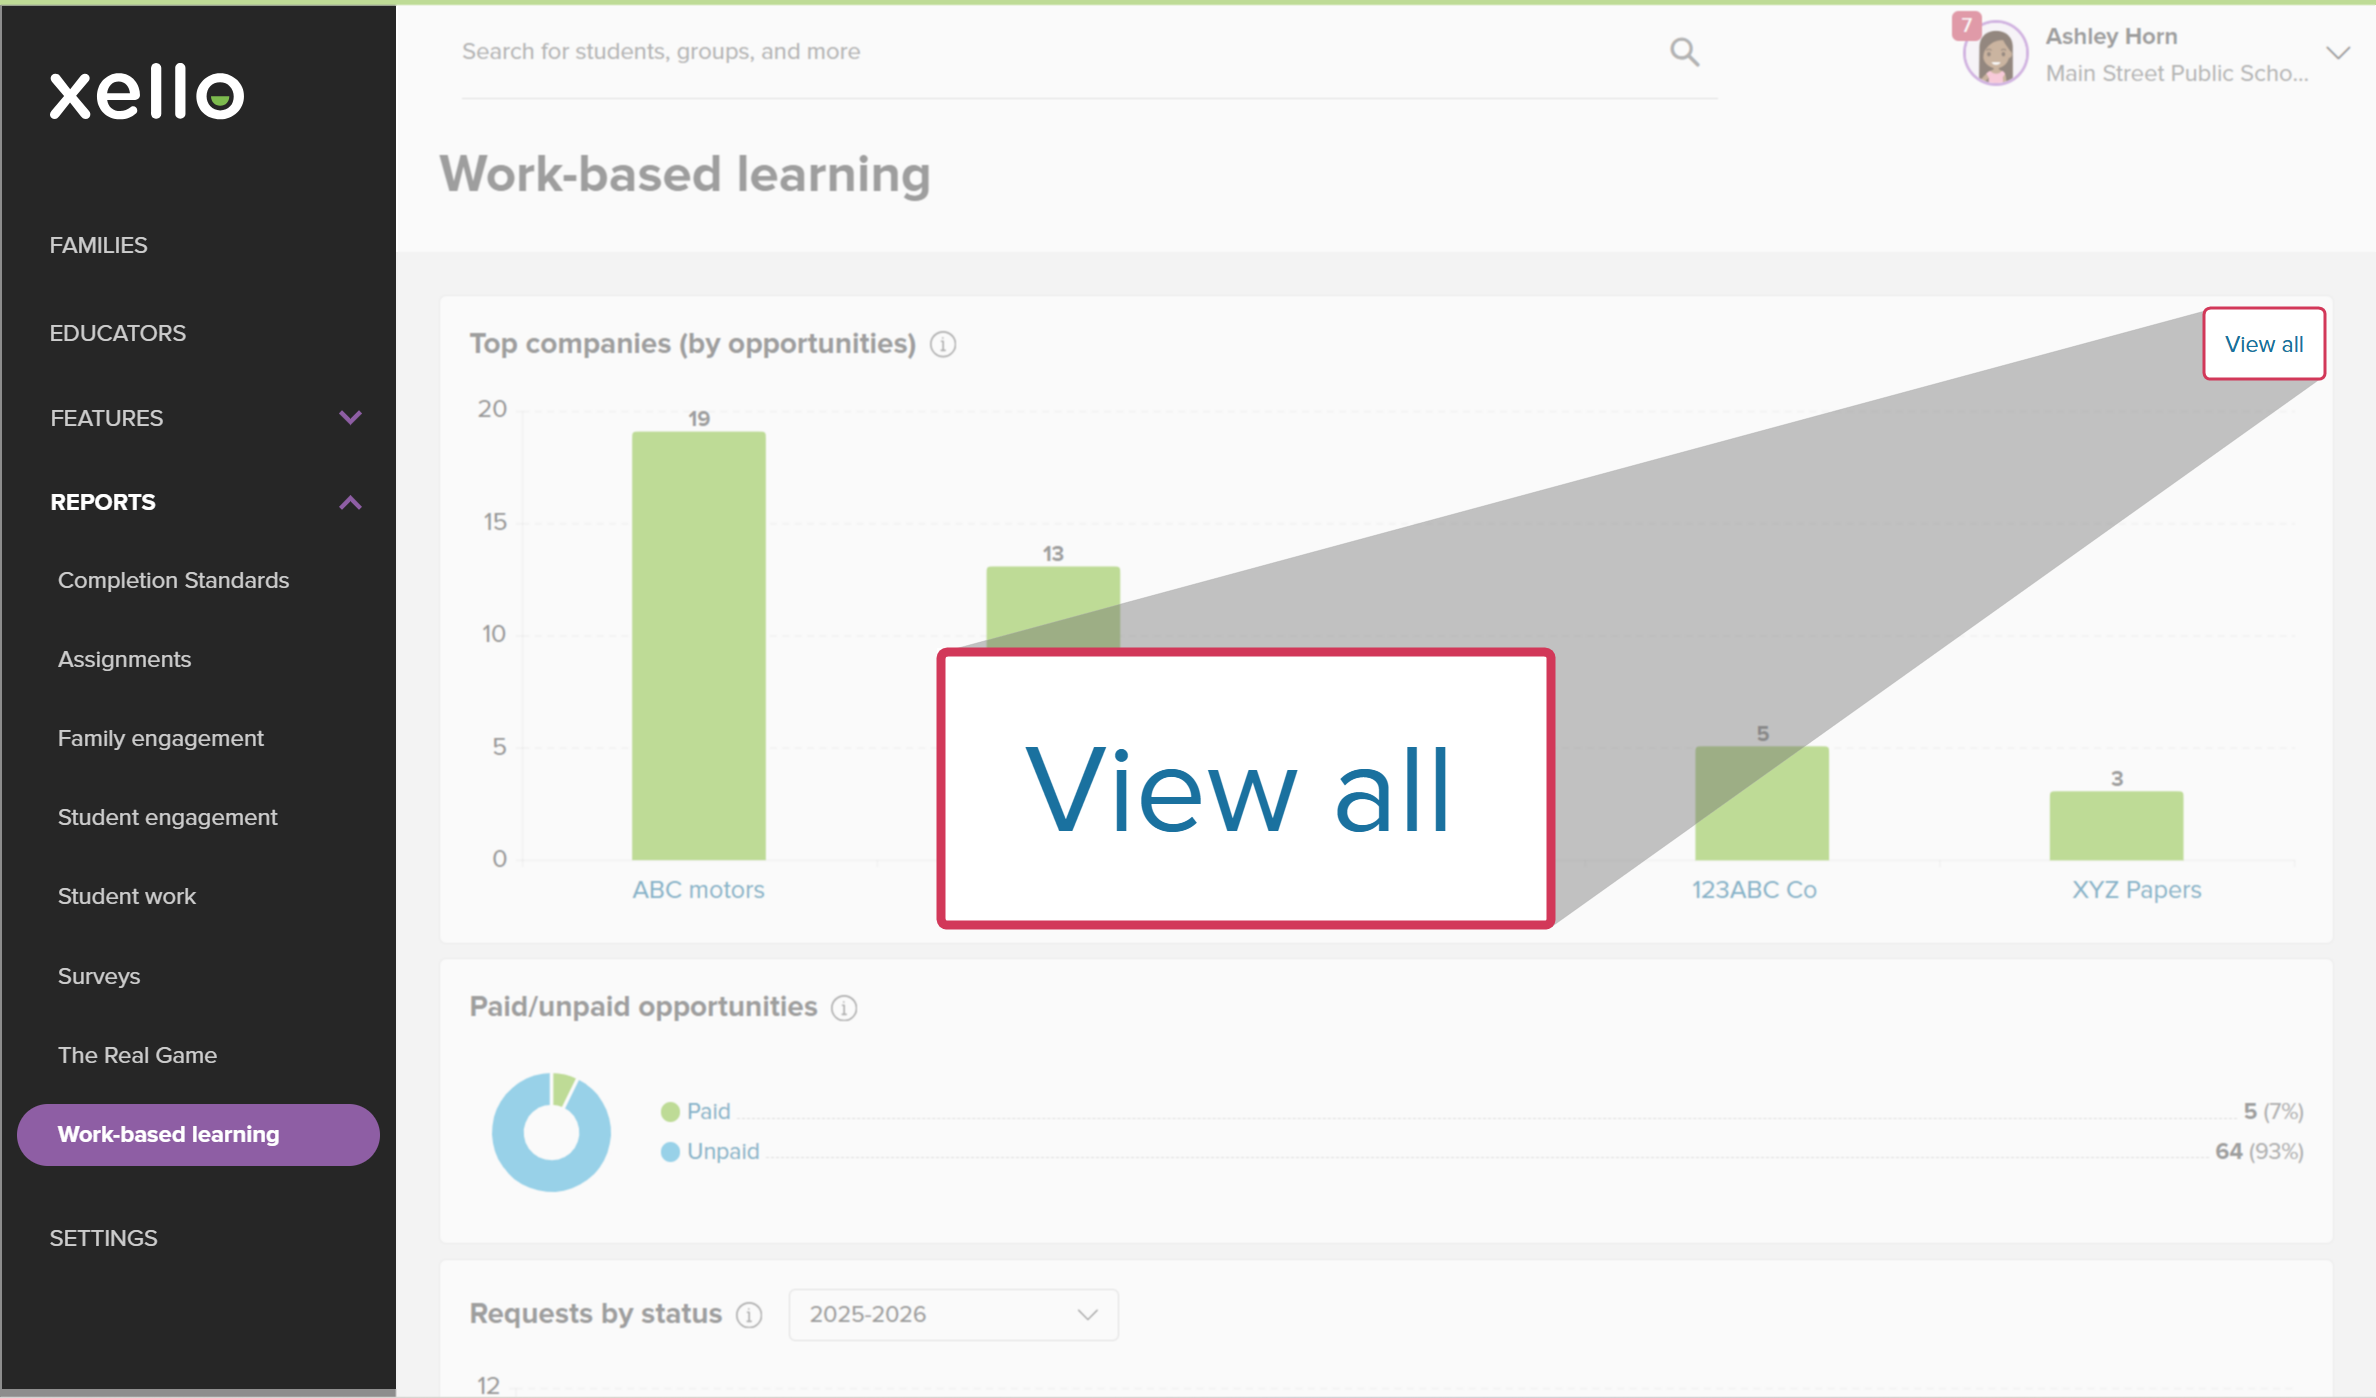 Click to enlarge
- Several charts let you change the school year. Changing the year allows you to instantly compare your current data against past years. This filter is based on when the student submitted the request.
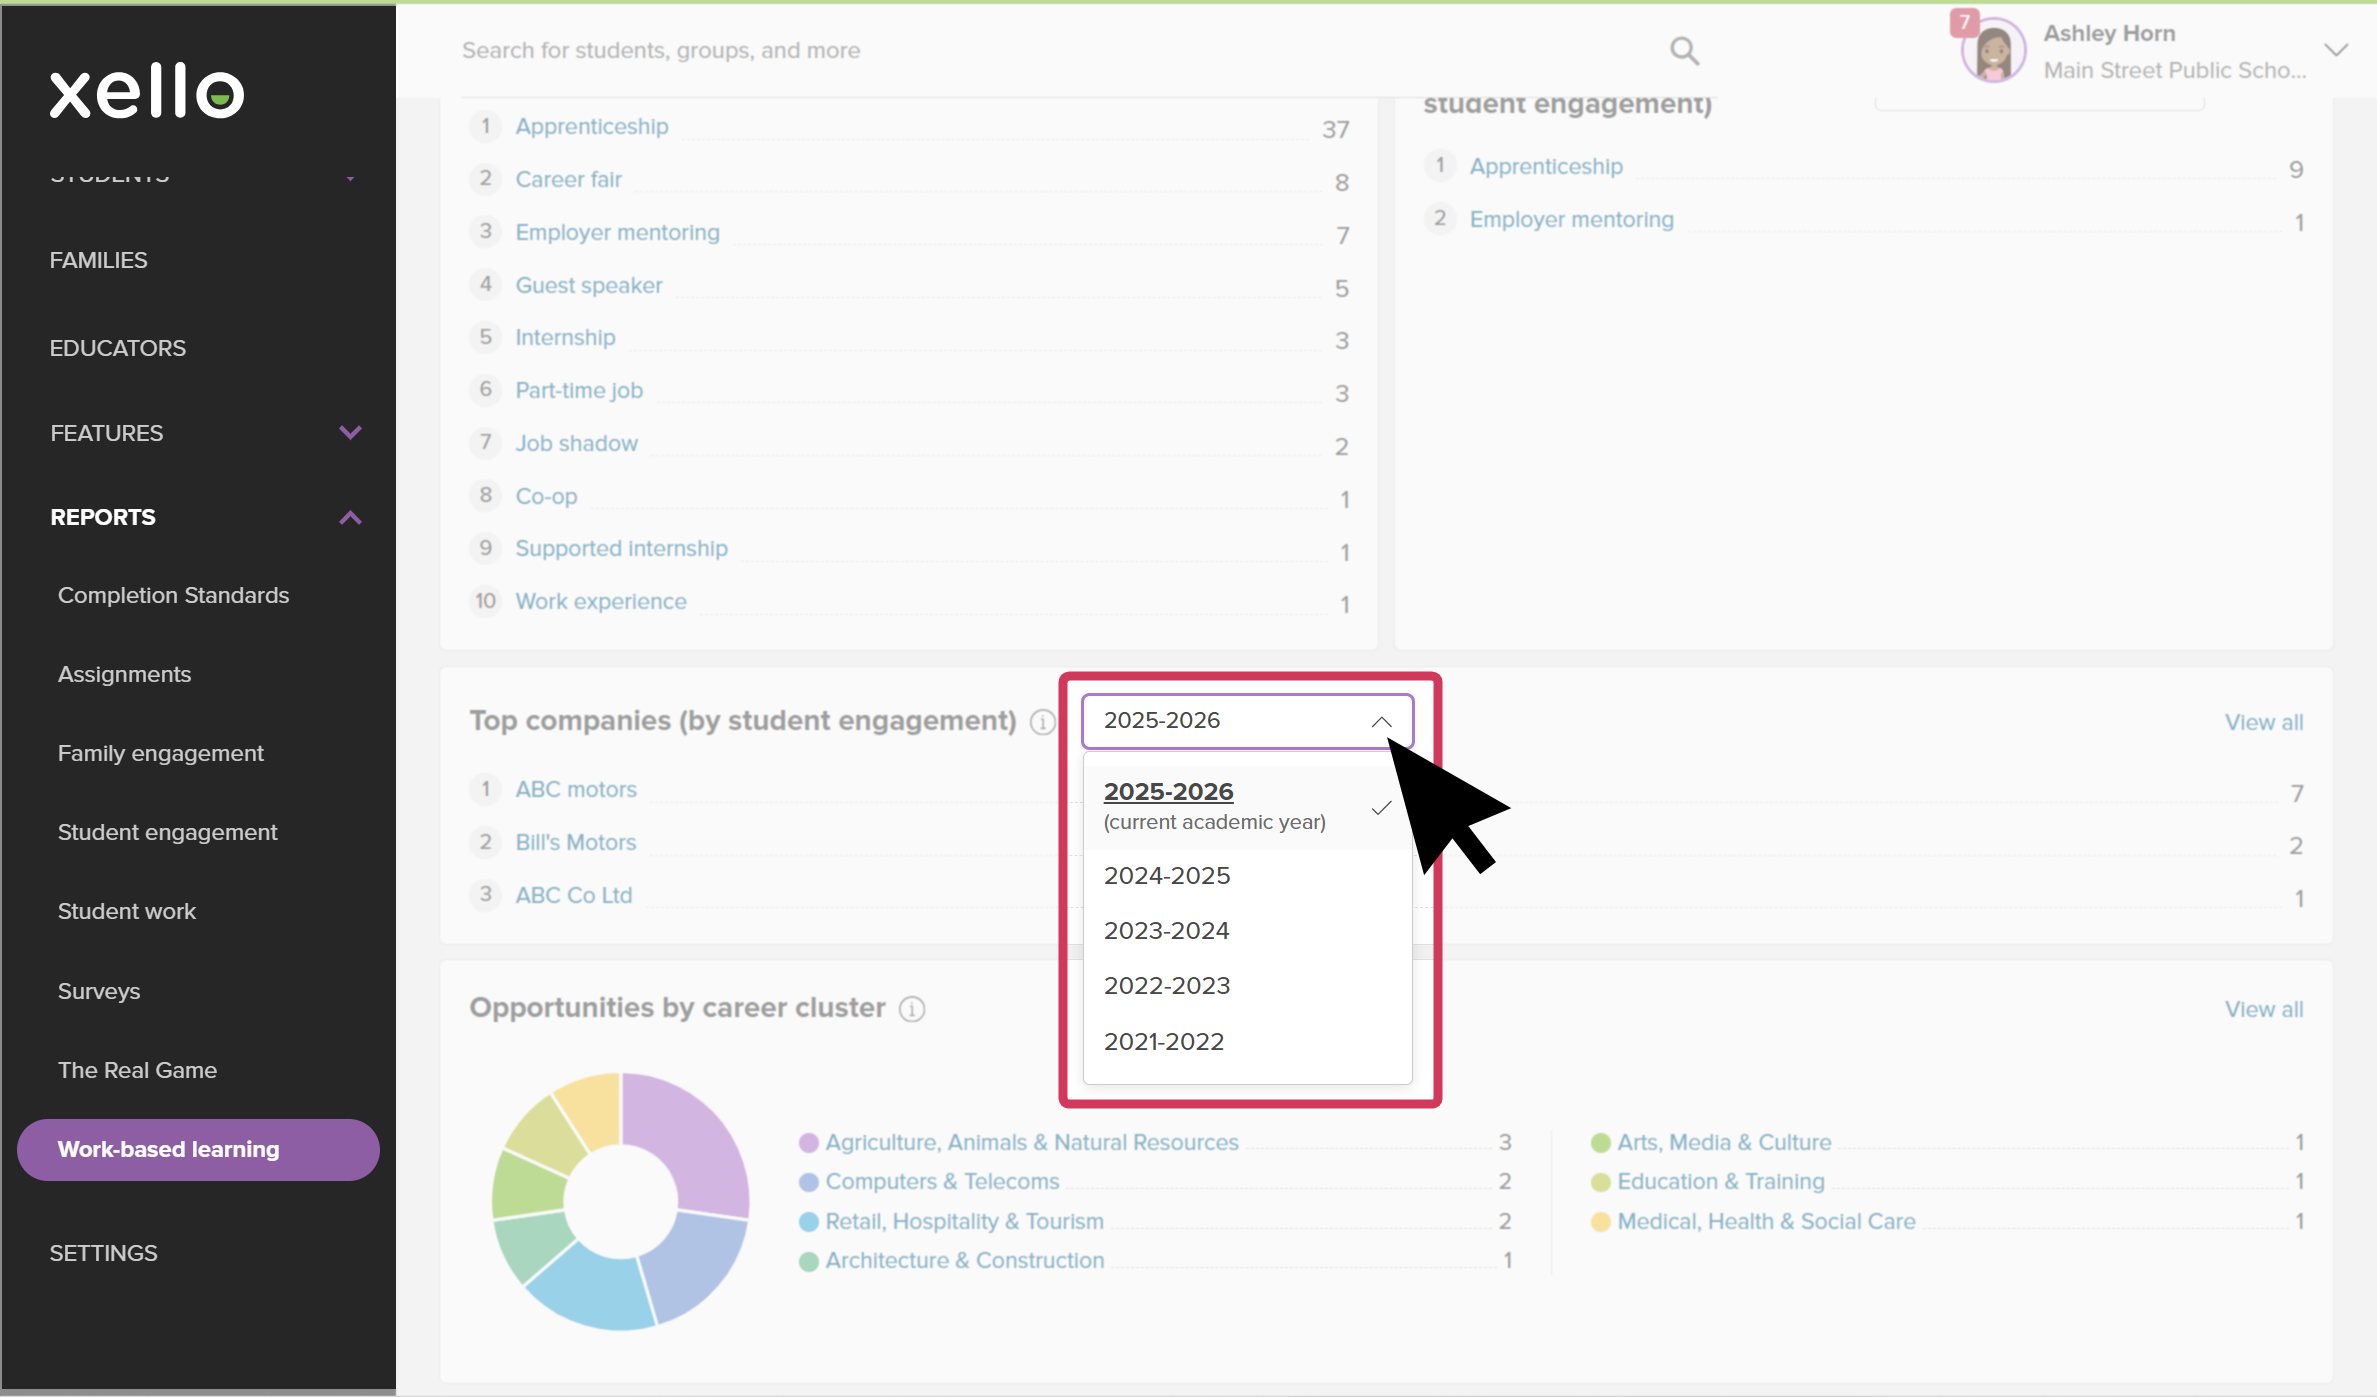 Click to enlarge
Table view
Once you click on a dashboard chart or link, you'll be redirected to a view of the data with a comprehensive table. This view allows you to manage the rows of text,
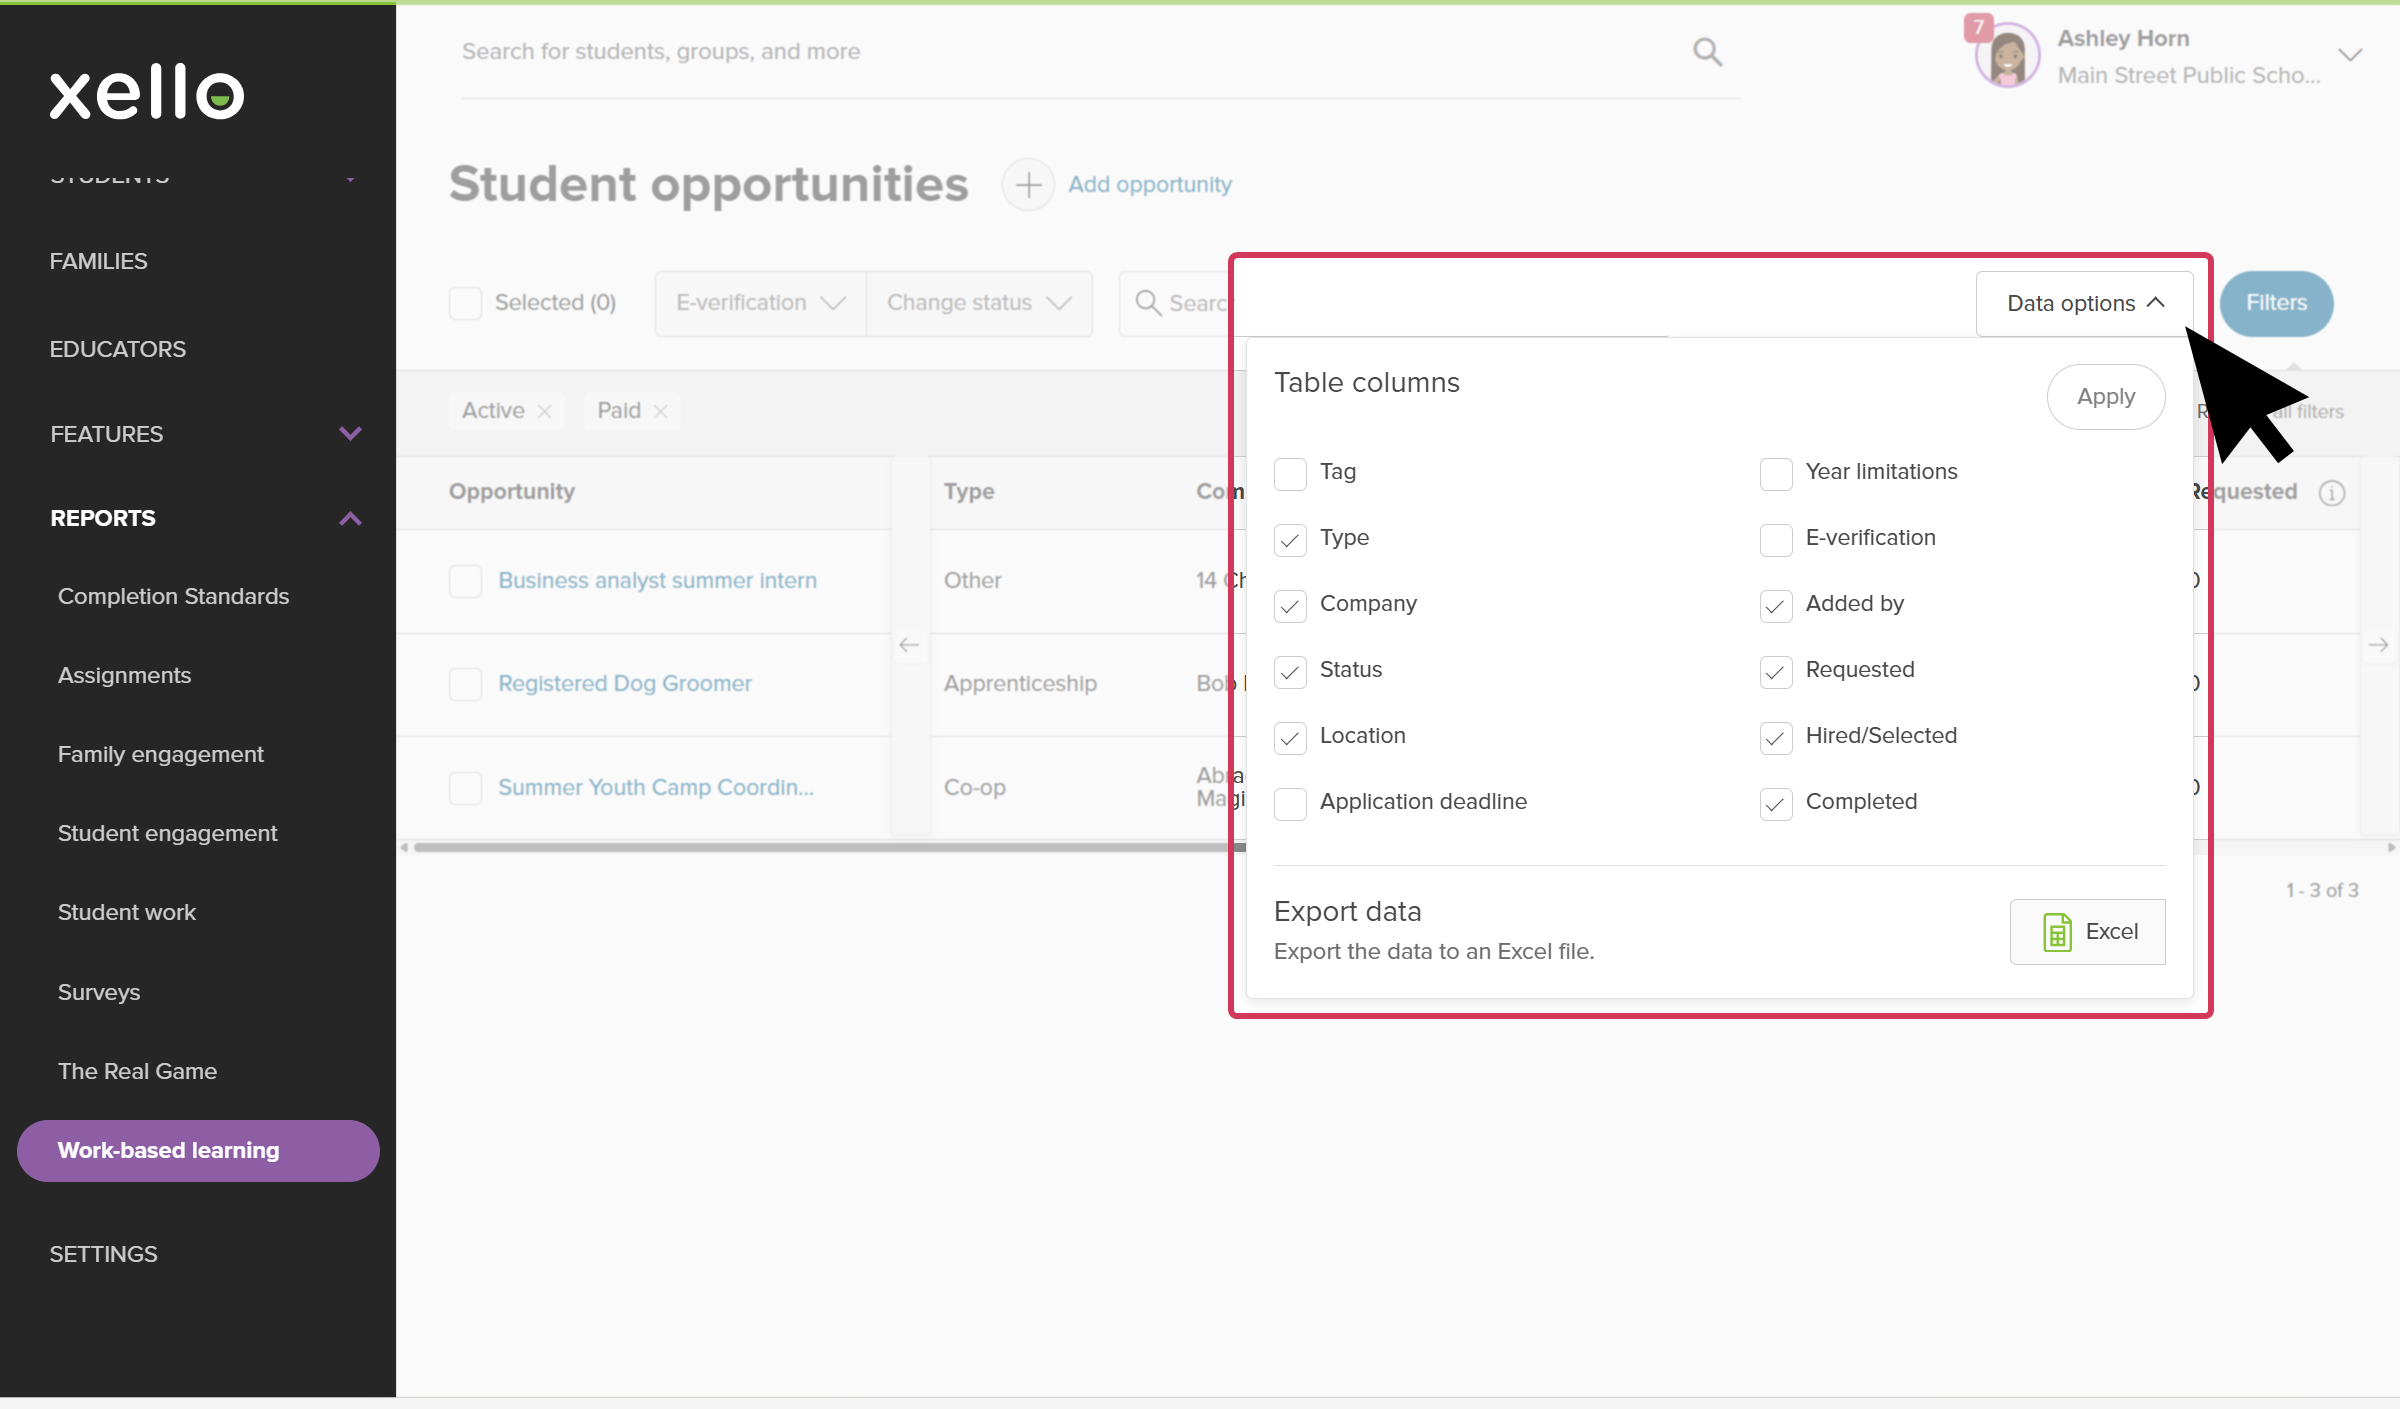
- Click Data options and select which table columns you'd like to have visible, then click Apply.
 Click to enlarge
- Also from Data options, you can opt to export the table to an Excel or CSV file.
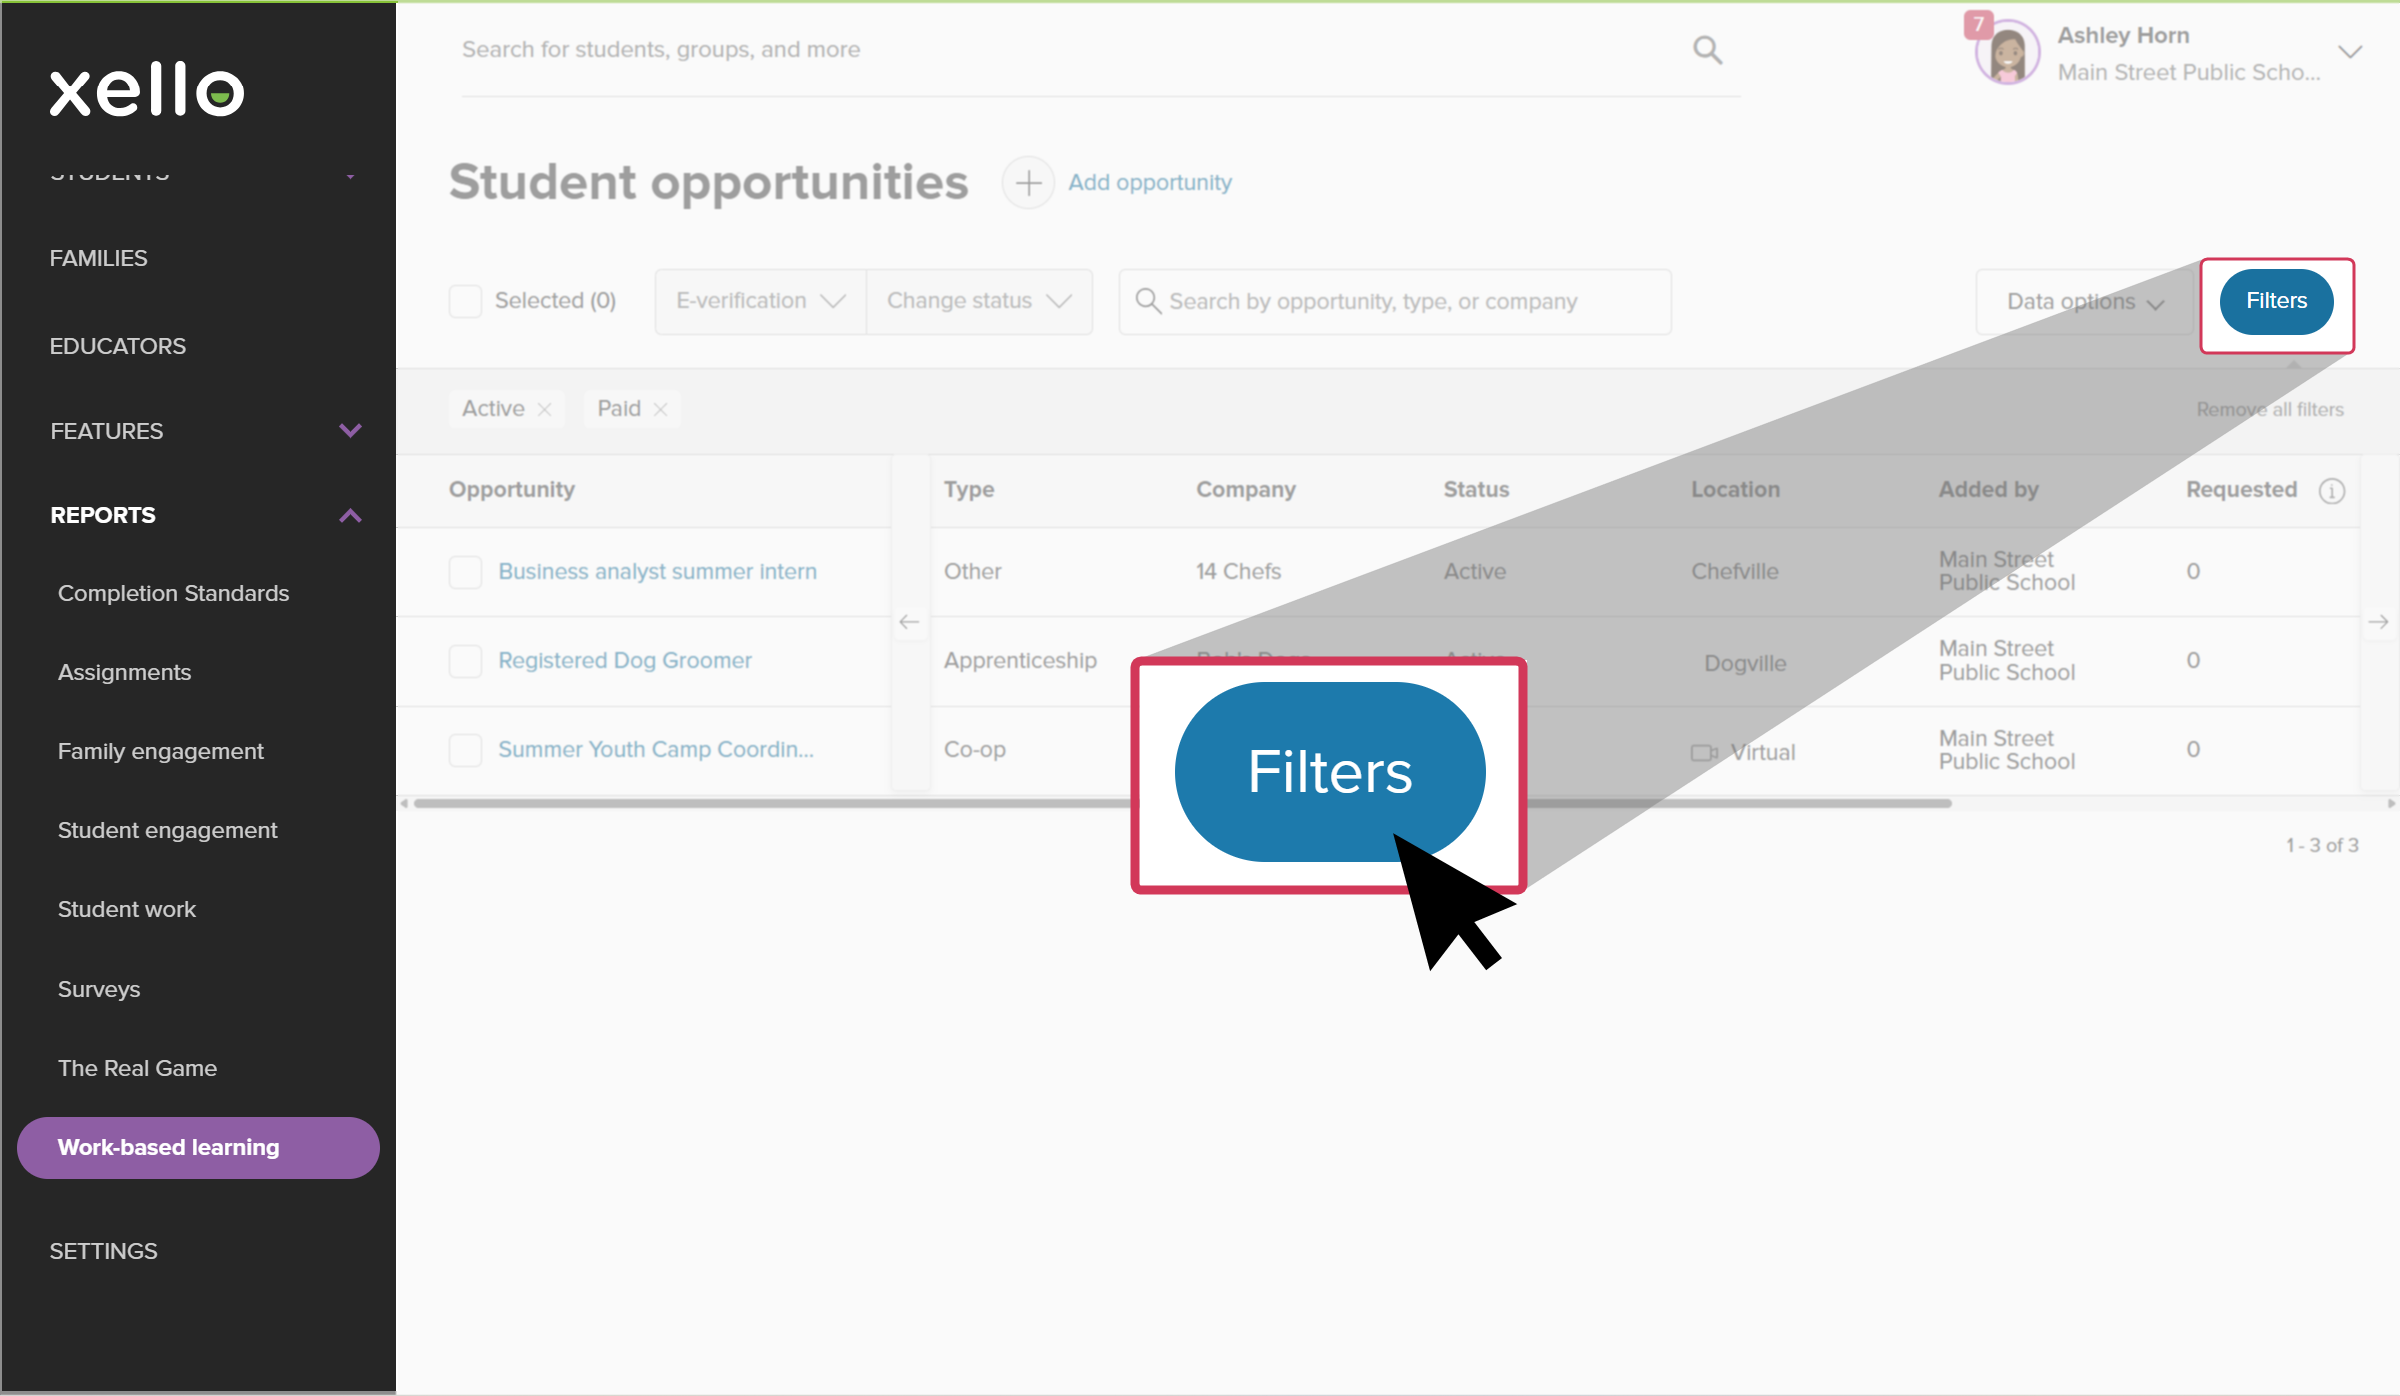
- Click Filters to narrow the table list by a variety of options. Depending on the report, these can include who added an opportunity, the type of opportunity, the career cluster, and status.
 Click to enlarge
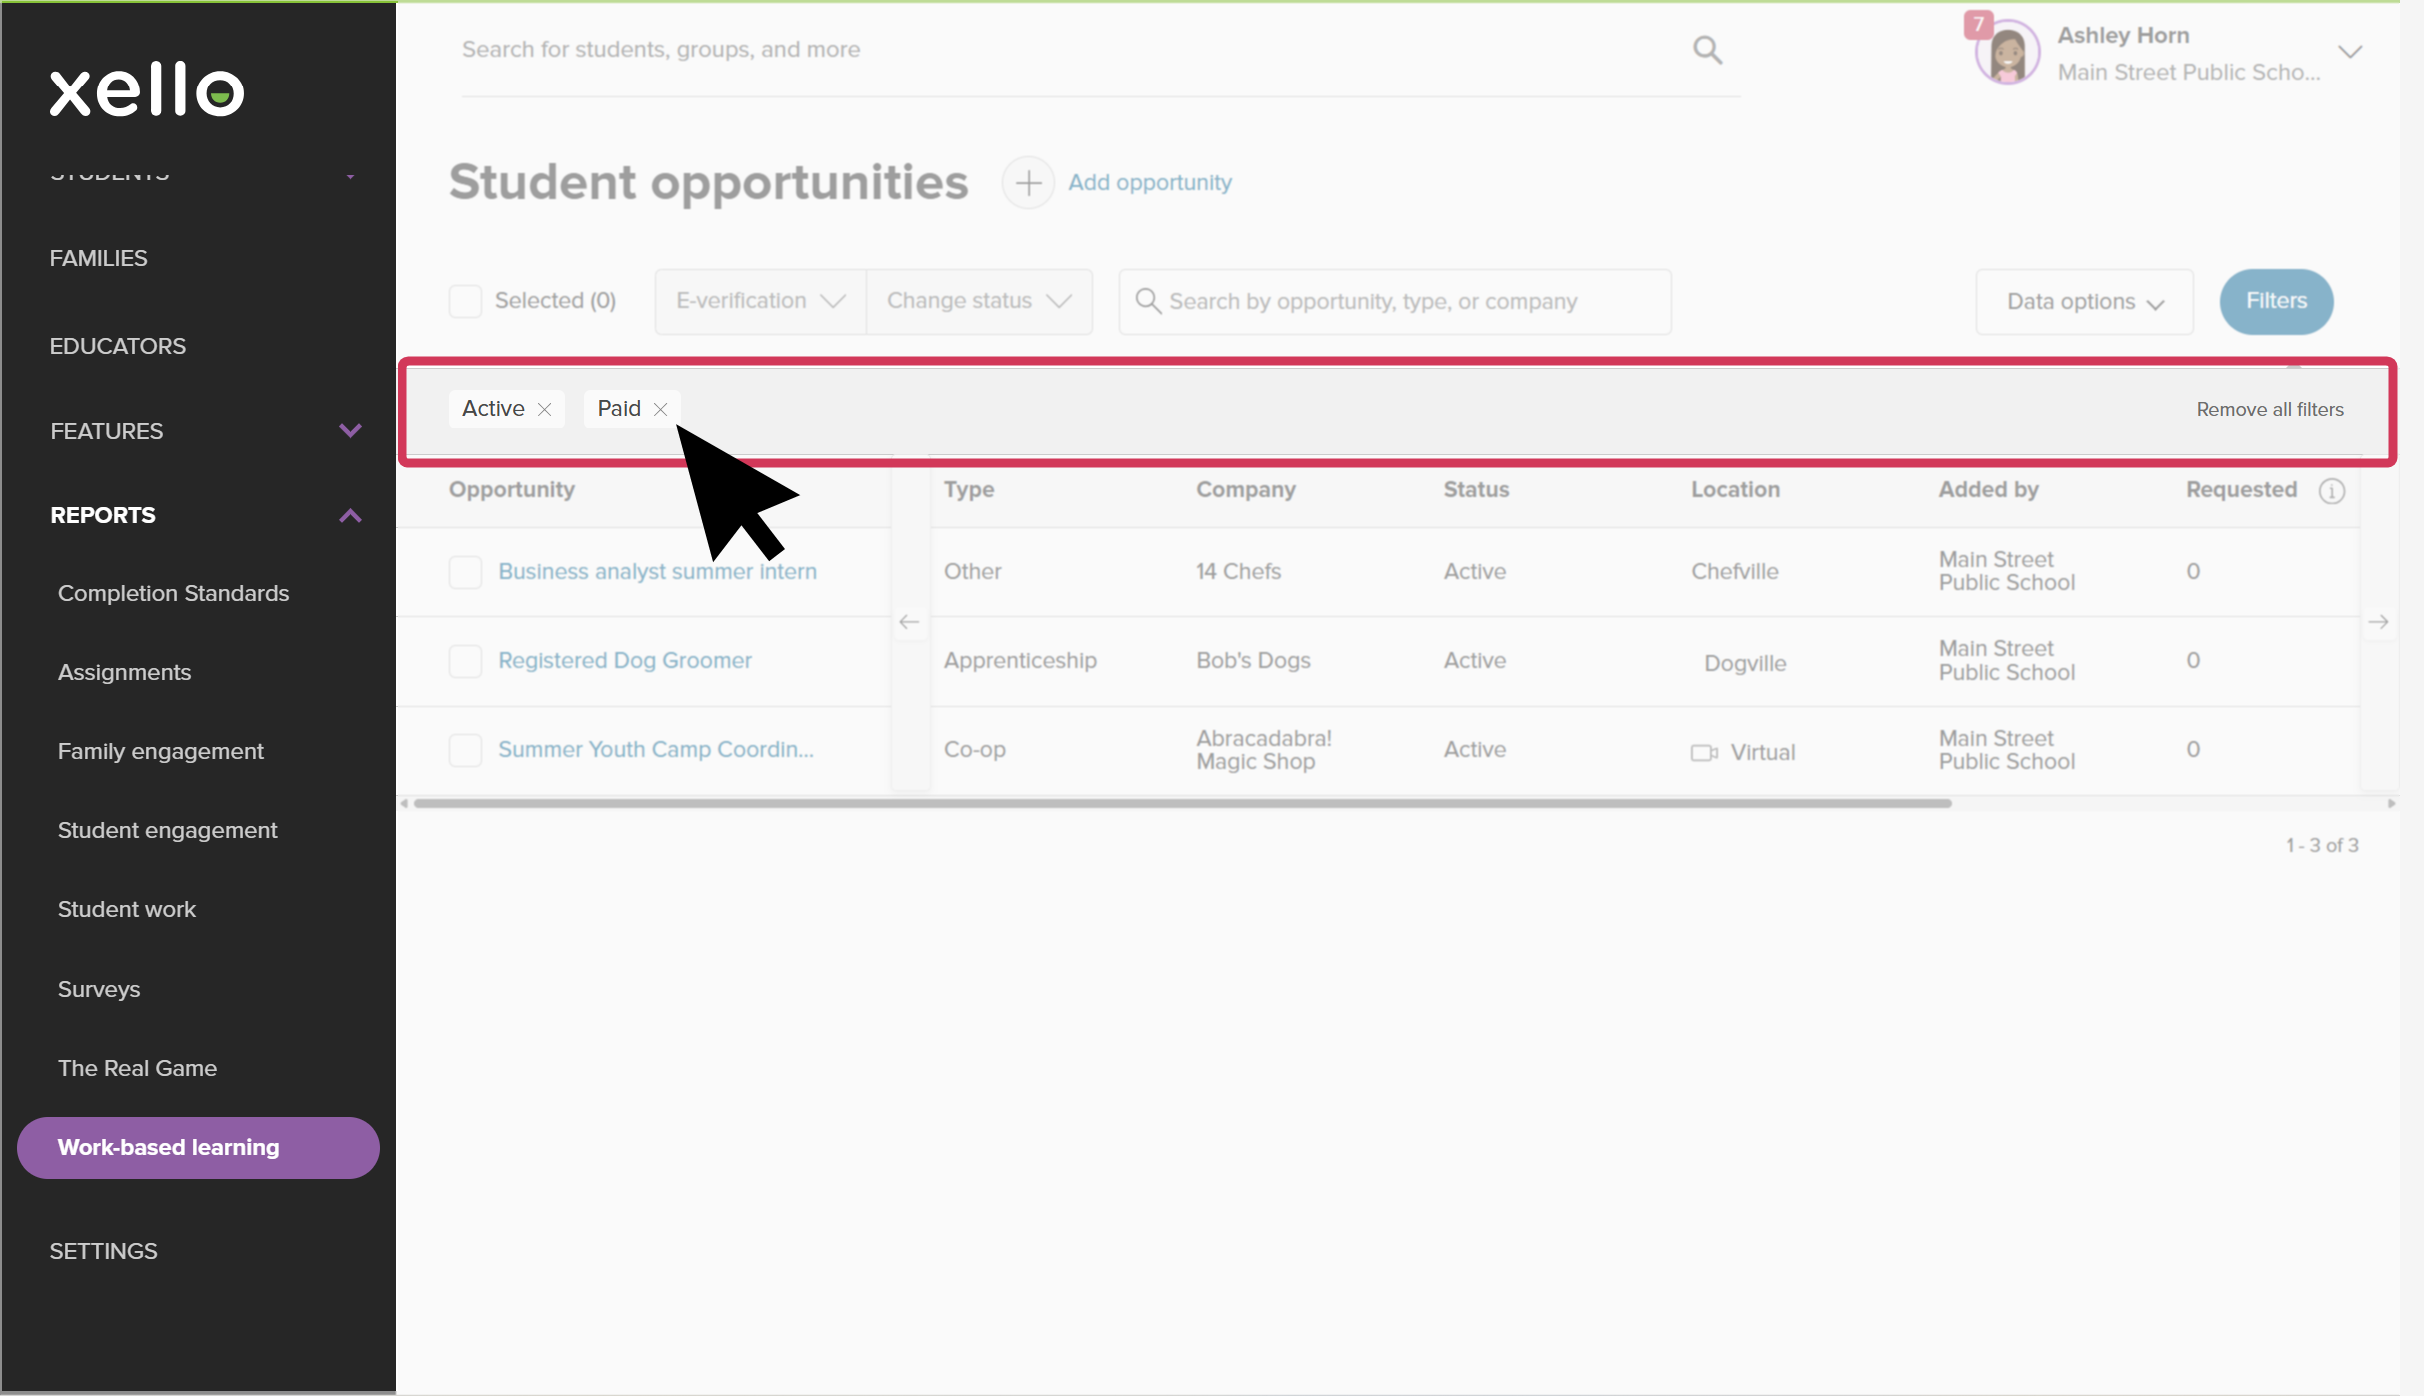
- To remove filters, click the X next to a filter name, or quickly get rid of them all by clicking Remove all filters.
 Click to enlarge
Additional resources
-
 Xello academy
Xello's Work-based learning module
Xello academy
Xello academyXello's Work-based learning moduleAre you a WBL administrator or coordinator working with Xello's Work-Based Learning module? In this course you'll learn how to utilize the additional features students have access to in Xello as you guide students in their exploration of WBL.
-
 PDF
PDFIntroduction to WBL in Xello
PDF
PDFIntroduction to WBL in Xello -
 Short Video
Help students thrive with Work-based learning
Short Video
Short VideoHelp students thrive with Work-based learningUse this short overview video to get an introduction to Xello's work-based learning module. Learn how this integrated platform opens up a world of discovery for students and educators to better prepare them for an ever-changing world.
-
 Recorded webinar
Recorded WebinarThe Basics: WBL in Xello for Admin
Recorded webinar
Recorded WebinarThe Basics: WBL in Xello for Admin -
Recorded webinar
Recorded WebinarBeyond Basics: WBL Learning in Xello for Admin
-
 Xello Resource
Get Started for WBL Administrators
Xello Resource
Xello ResourceGet Started for WBL Administrators
 Back to top