Run a Student intentions report to get high-level insights into students' postsecondary plans, including their intended careers, colleges, and pathways. By bringing your students' saved options, college application activities, and plans together in one place, this report saves you time compiling the data and so you can spend more time acting on it.
With this big-picture view, you can give students exactly the help they need. You’ll be able to see who has a plan but hasn't taken the next steps, and find students who are still undecided or haven't saved options so you can reach out sooner and in a more focused way.Spotting these trends leads to stronger CCR decision-making, helping teams better plan their advising, programming, and resources.
Getting the most out of your report
The Student intentions report is a reflection of a combination of your students' work and the data put into Xello: the more you put in, the more you'll get out of the report. To ensure you have the most complete and actionable picture:
Encourage student exploration: The more your students engage with Xello by saving careers, clusters, and colleges, and ranking primary plans, then the more robust your reports will be. You can share these guides with students to help introduce the features:
- Plans in Xello
 (also available in Spanish )
 - How to track a college application (also available in Spanish )
- Track your FAFSA application in Xello (also available in Spanish )
- How to add your enrollment decision (also available in Spanish )
- About Me in Xello (also available in Spanish )
- Explore options in Xello (also available in Spanish )
Keep student data current: The reports rely on updated GPA scores and application statuses. When these are regularly imported or updated, you'll get the most accurate return. Check out these articles to learn more about how to update this data:
Access the report
The Student intentions report can be accessed in the Reports section of your educator account in Xello.
To access and run the Student intentions report:
- From your educator account, click Reports and select Student intentions.
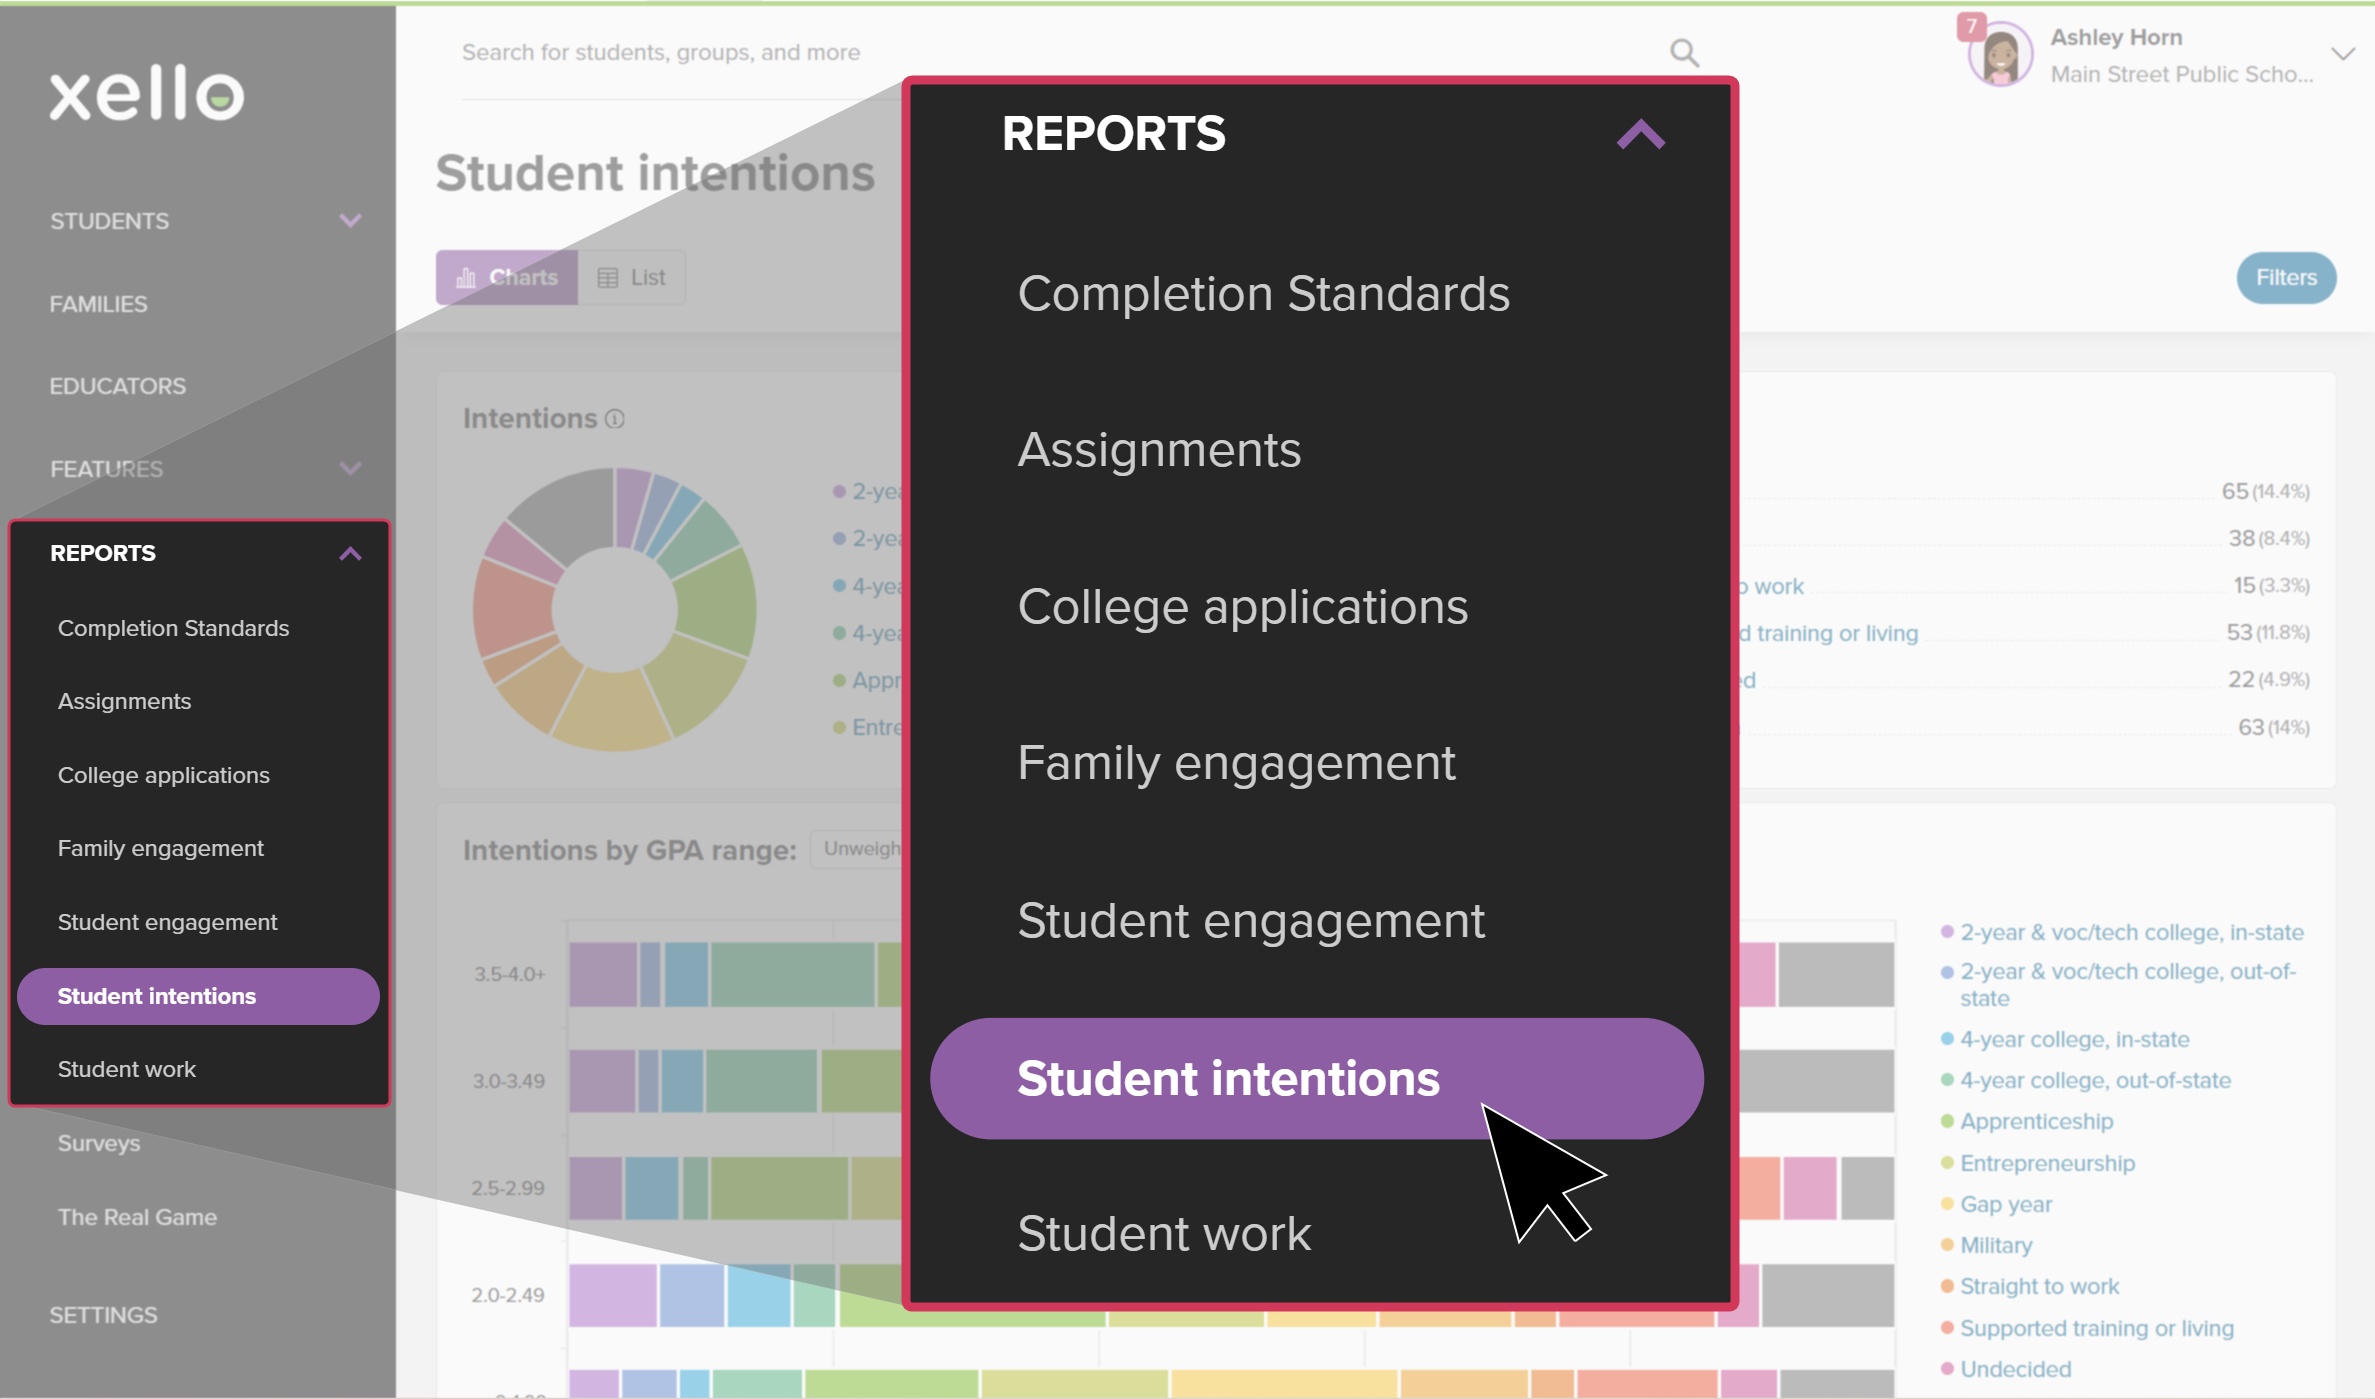 Click to enlarge
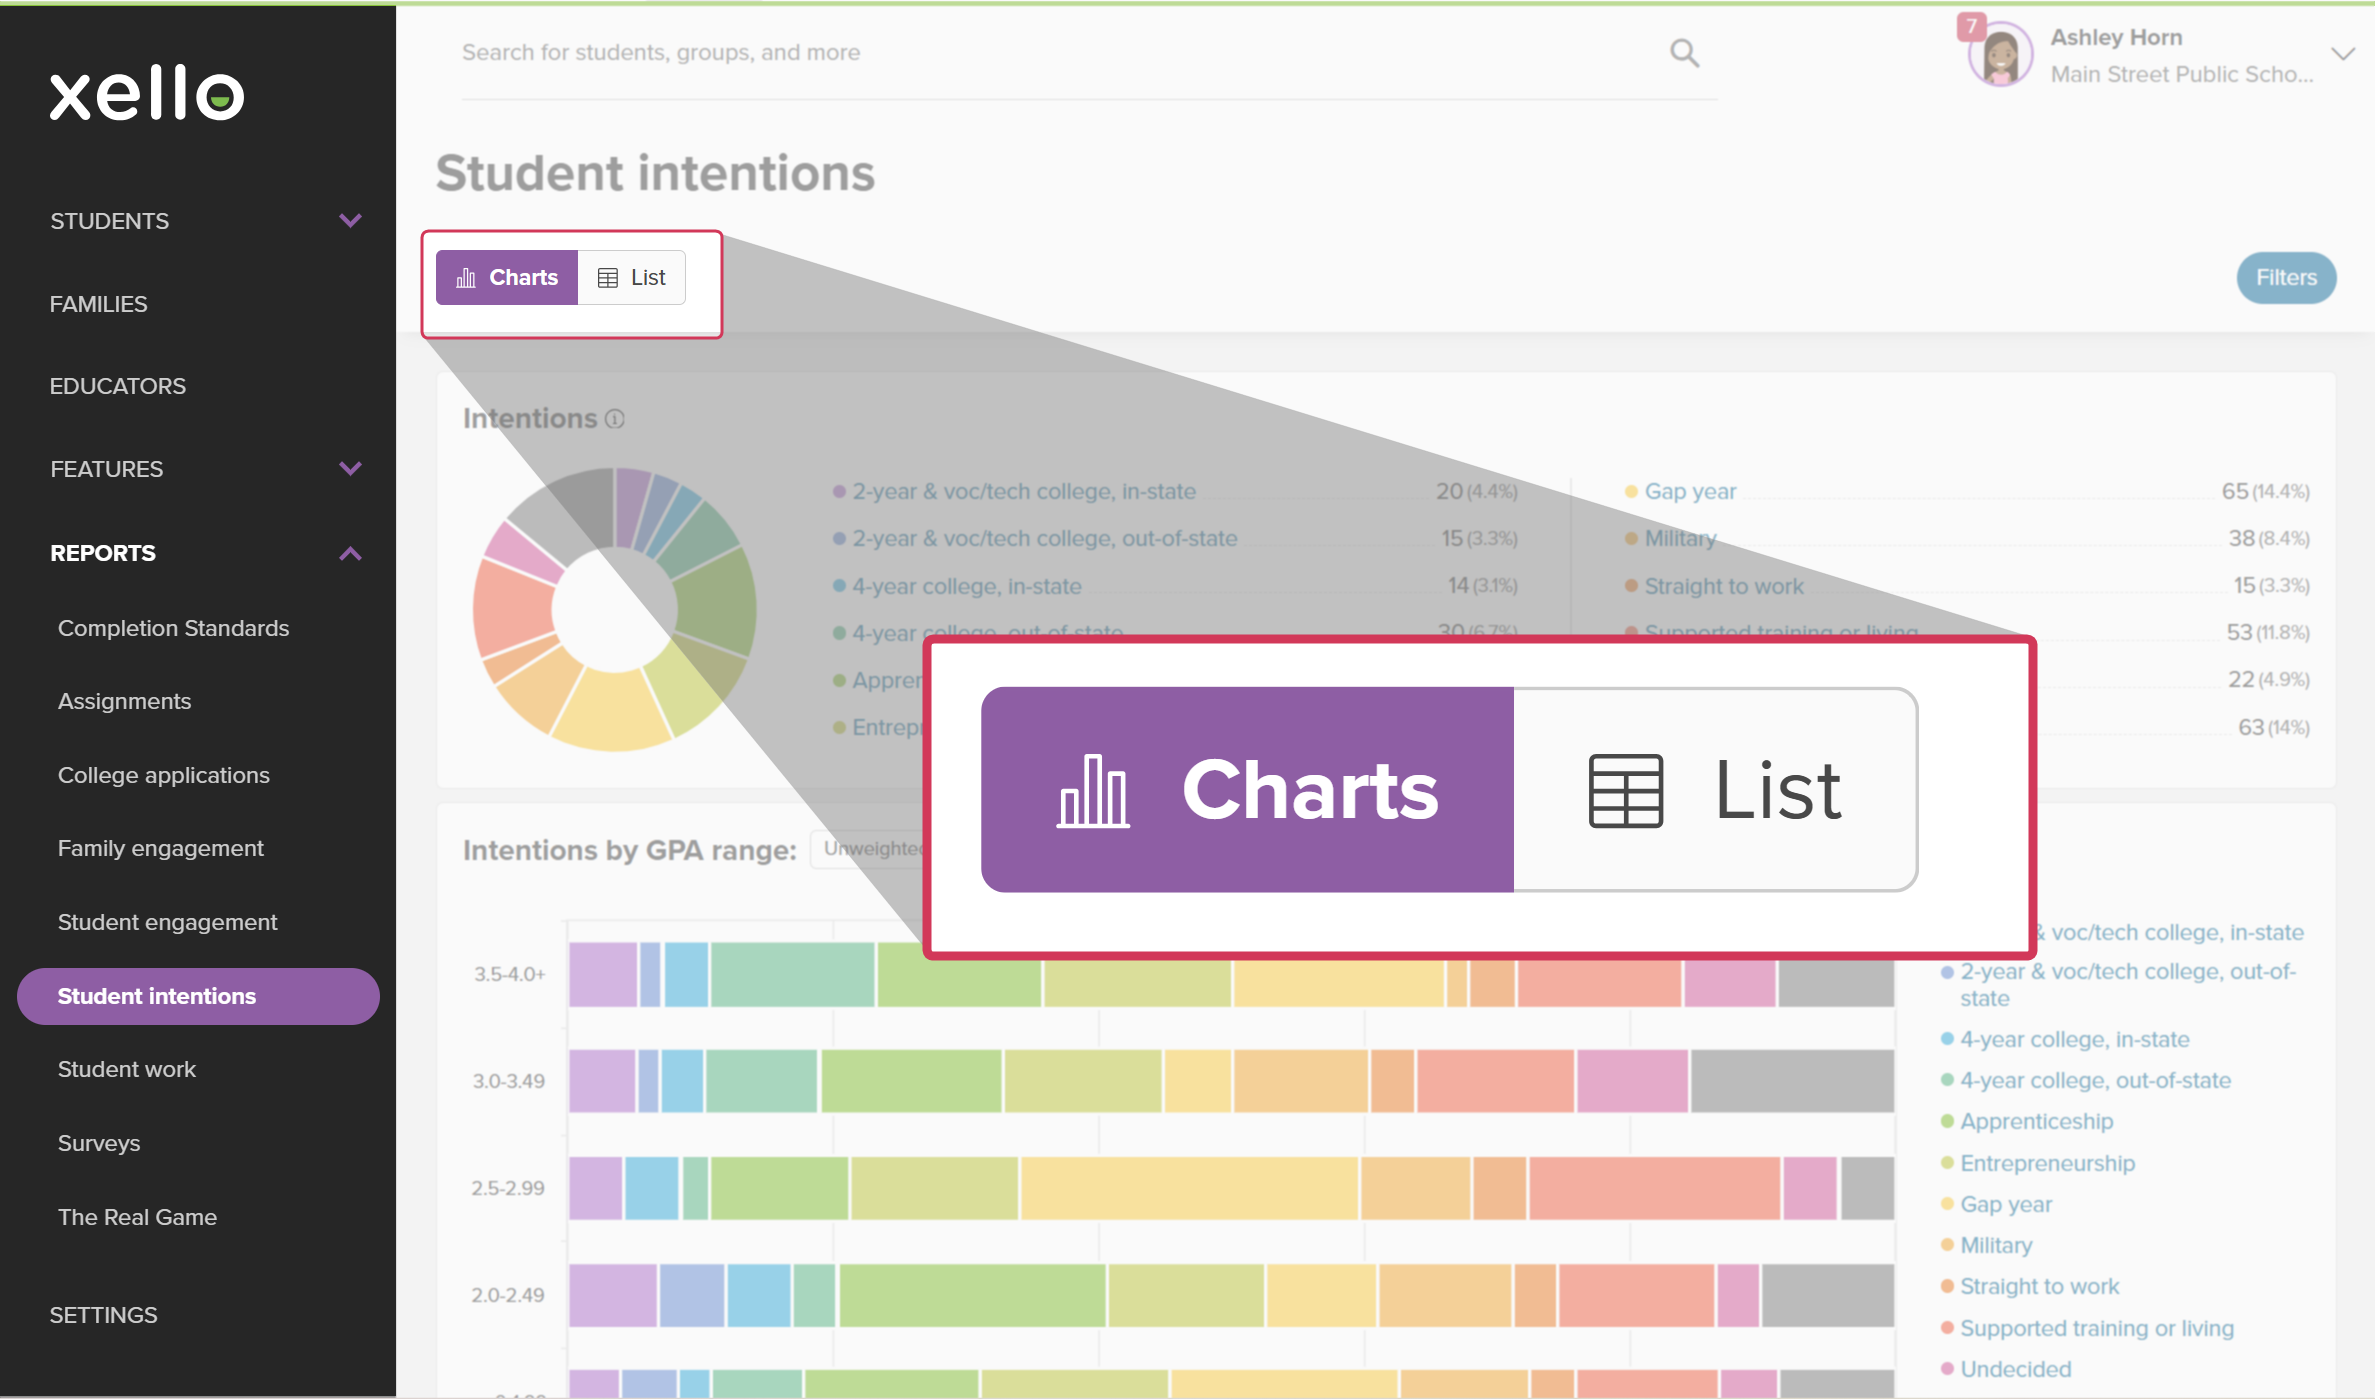
- Once on the landing page, you can opt to view the data in Charts or in a List.
 Click to enlarge
- Charts view: a graphical overview of the student data, great for identifying trends and patterns.
- List view: a tabular view of individual student data, great for searching, viewing custom data columns, and exporting to Excel or CSV.
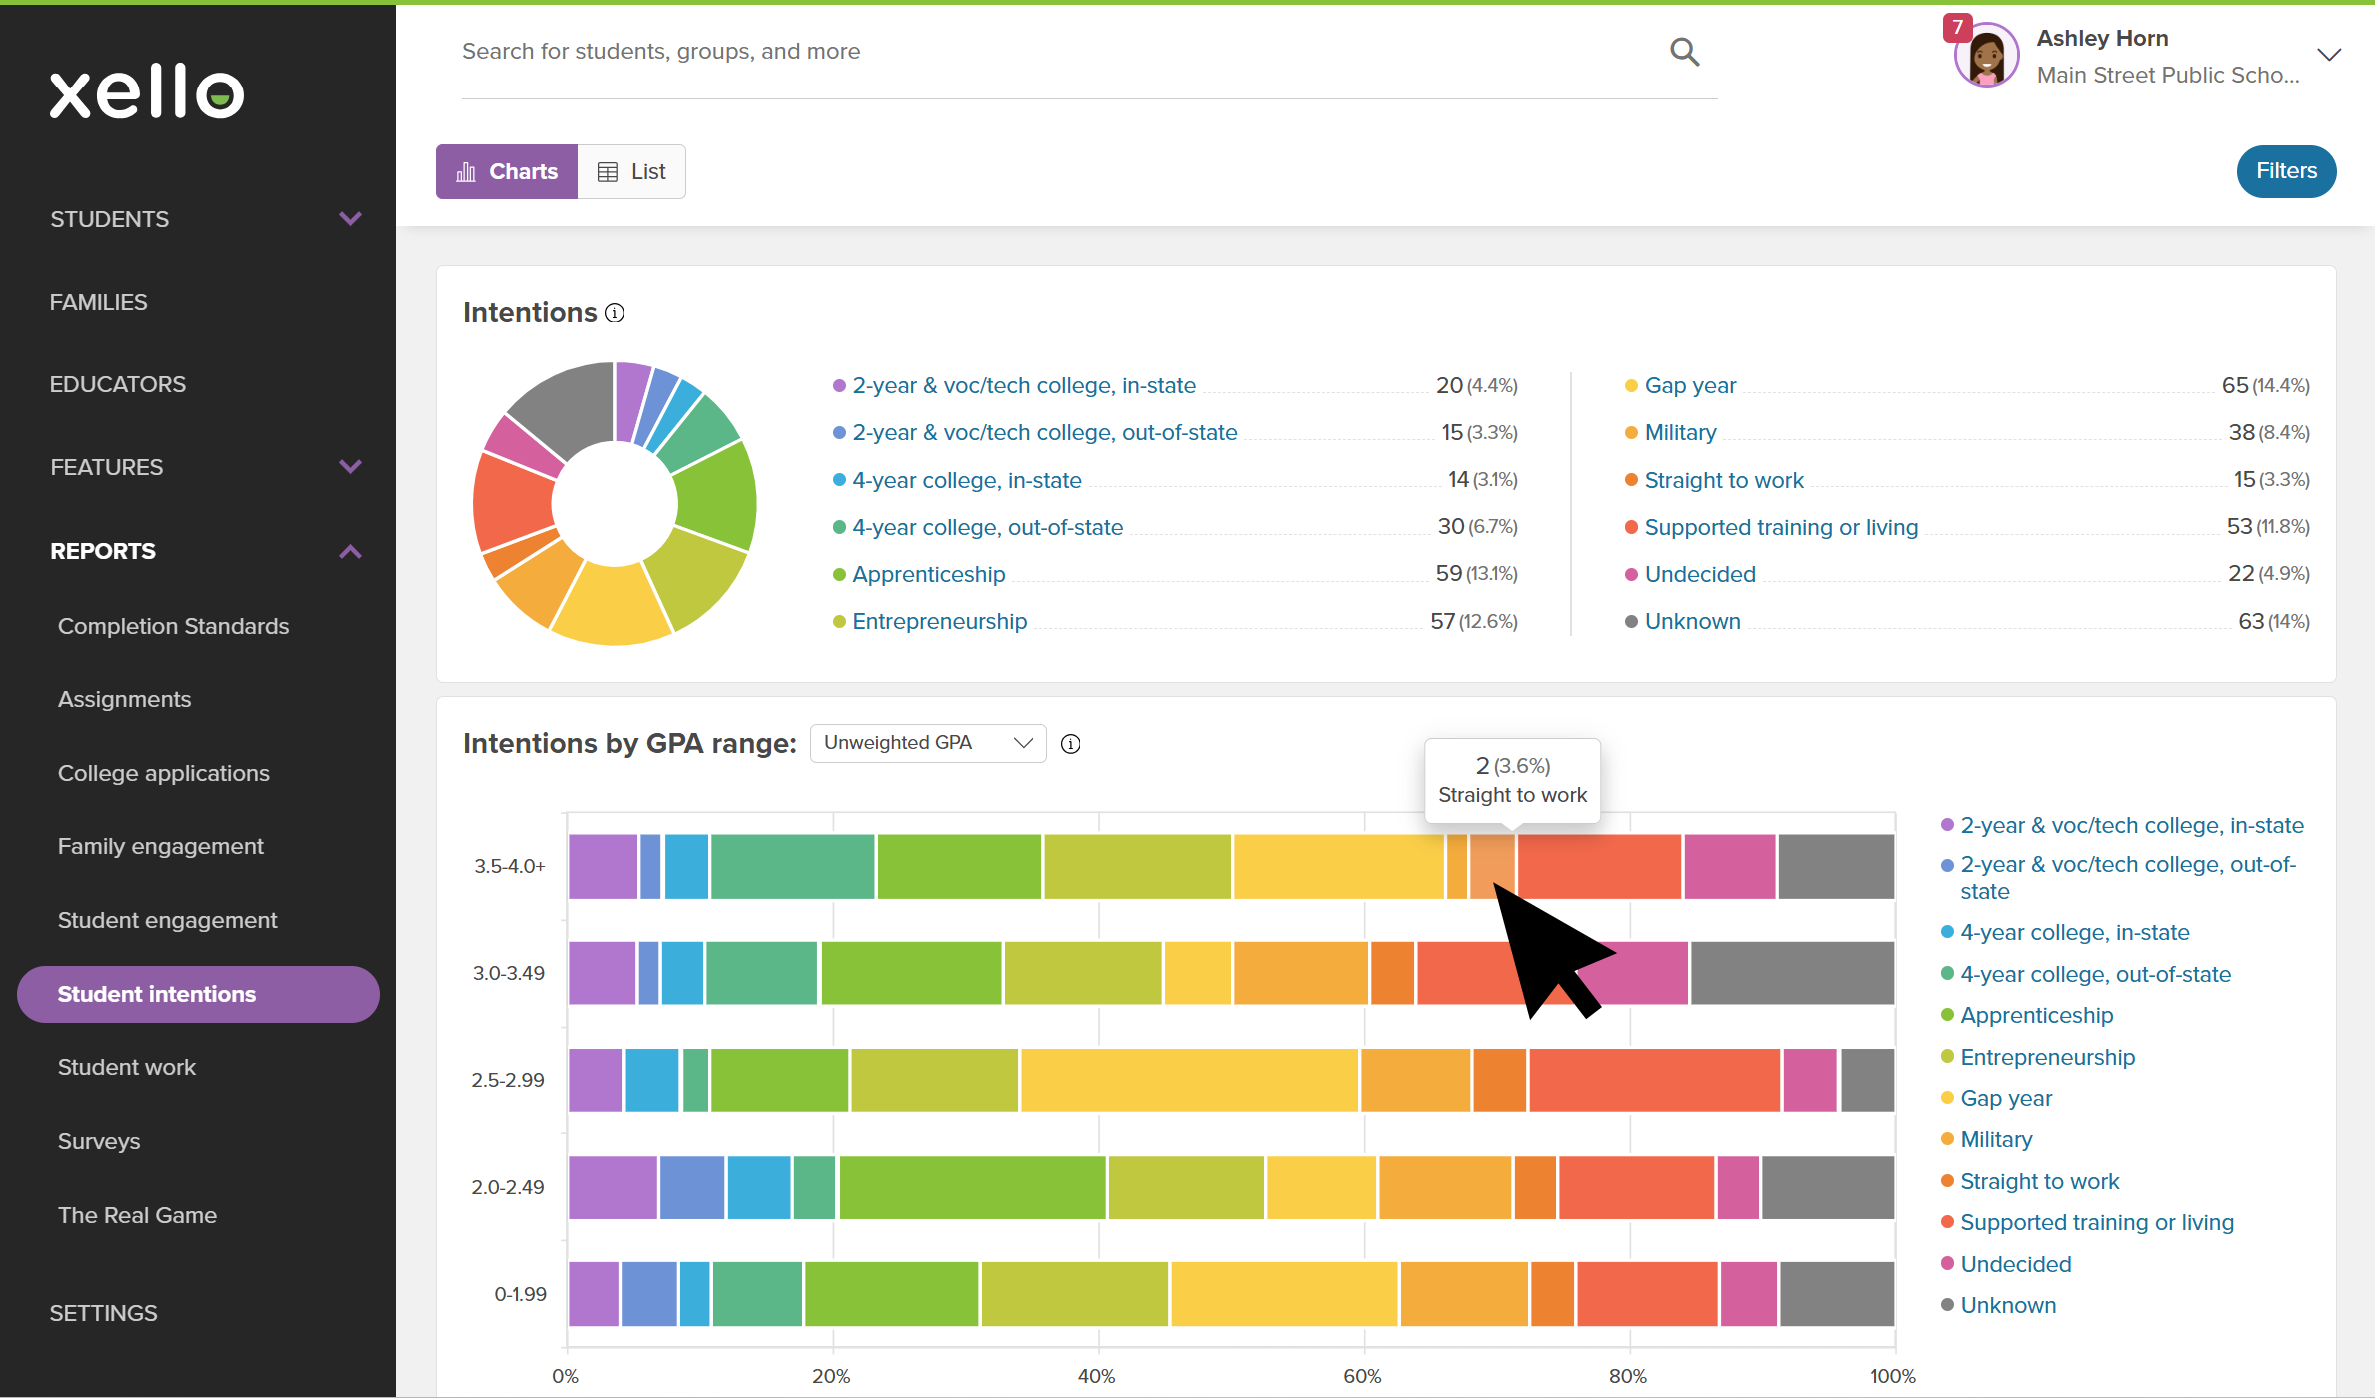
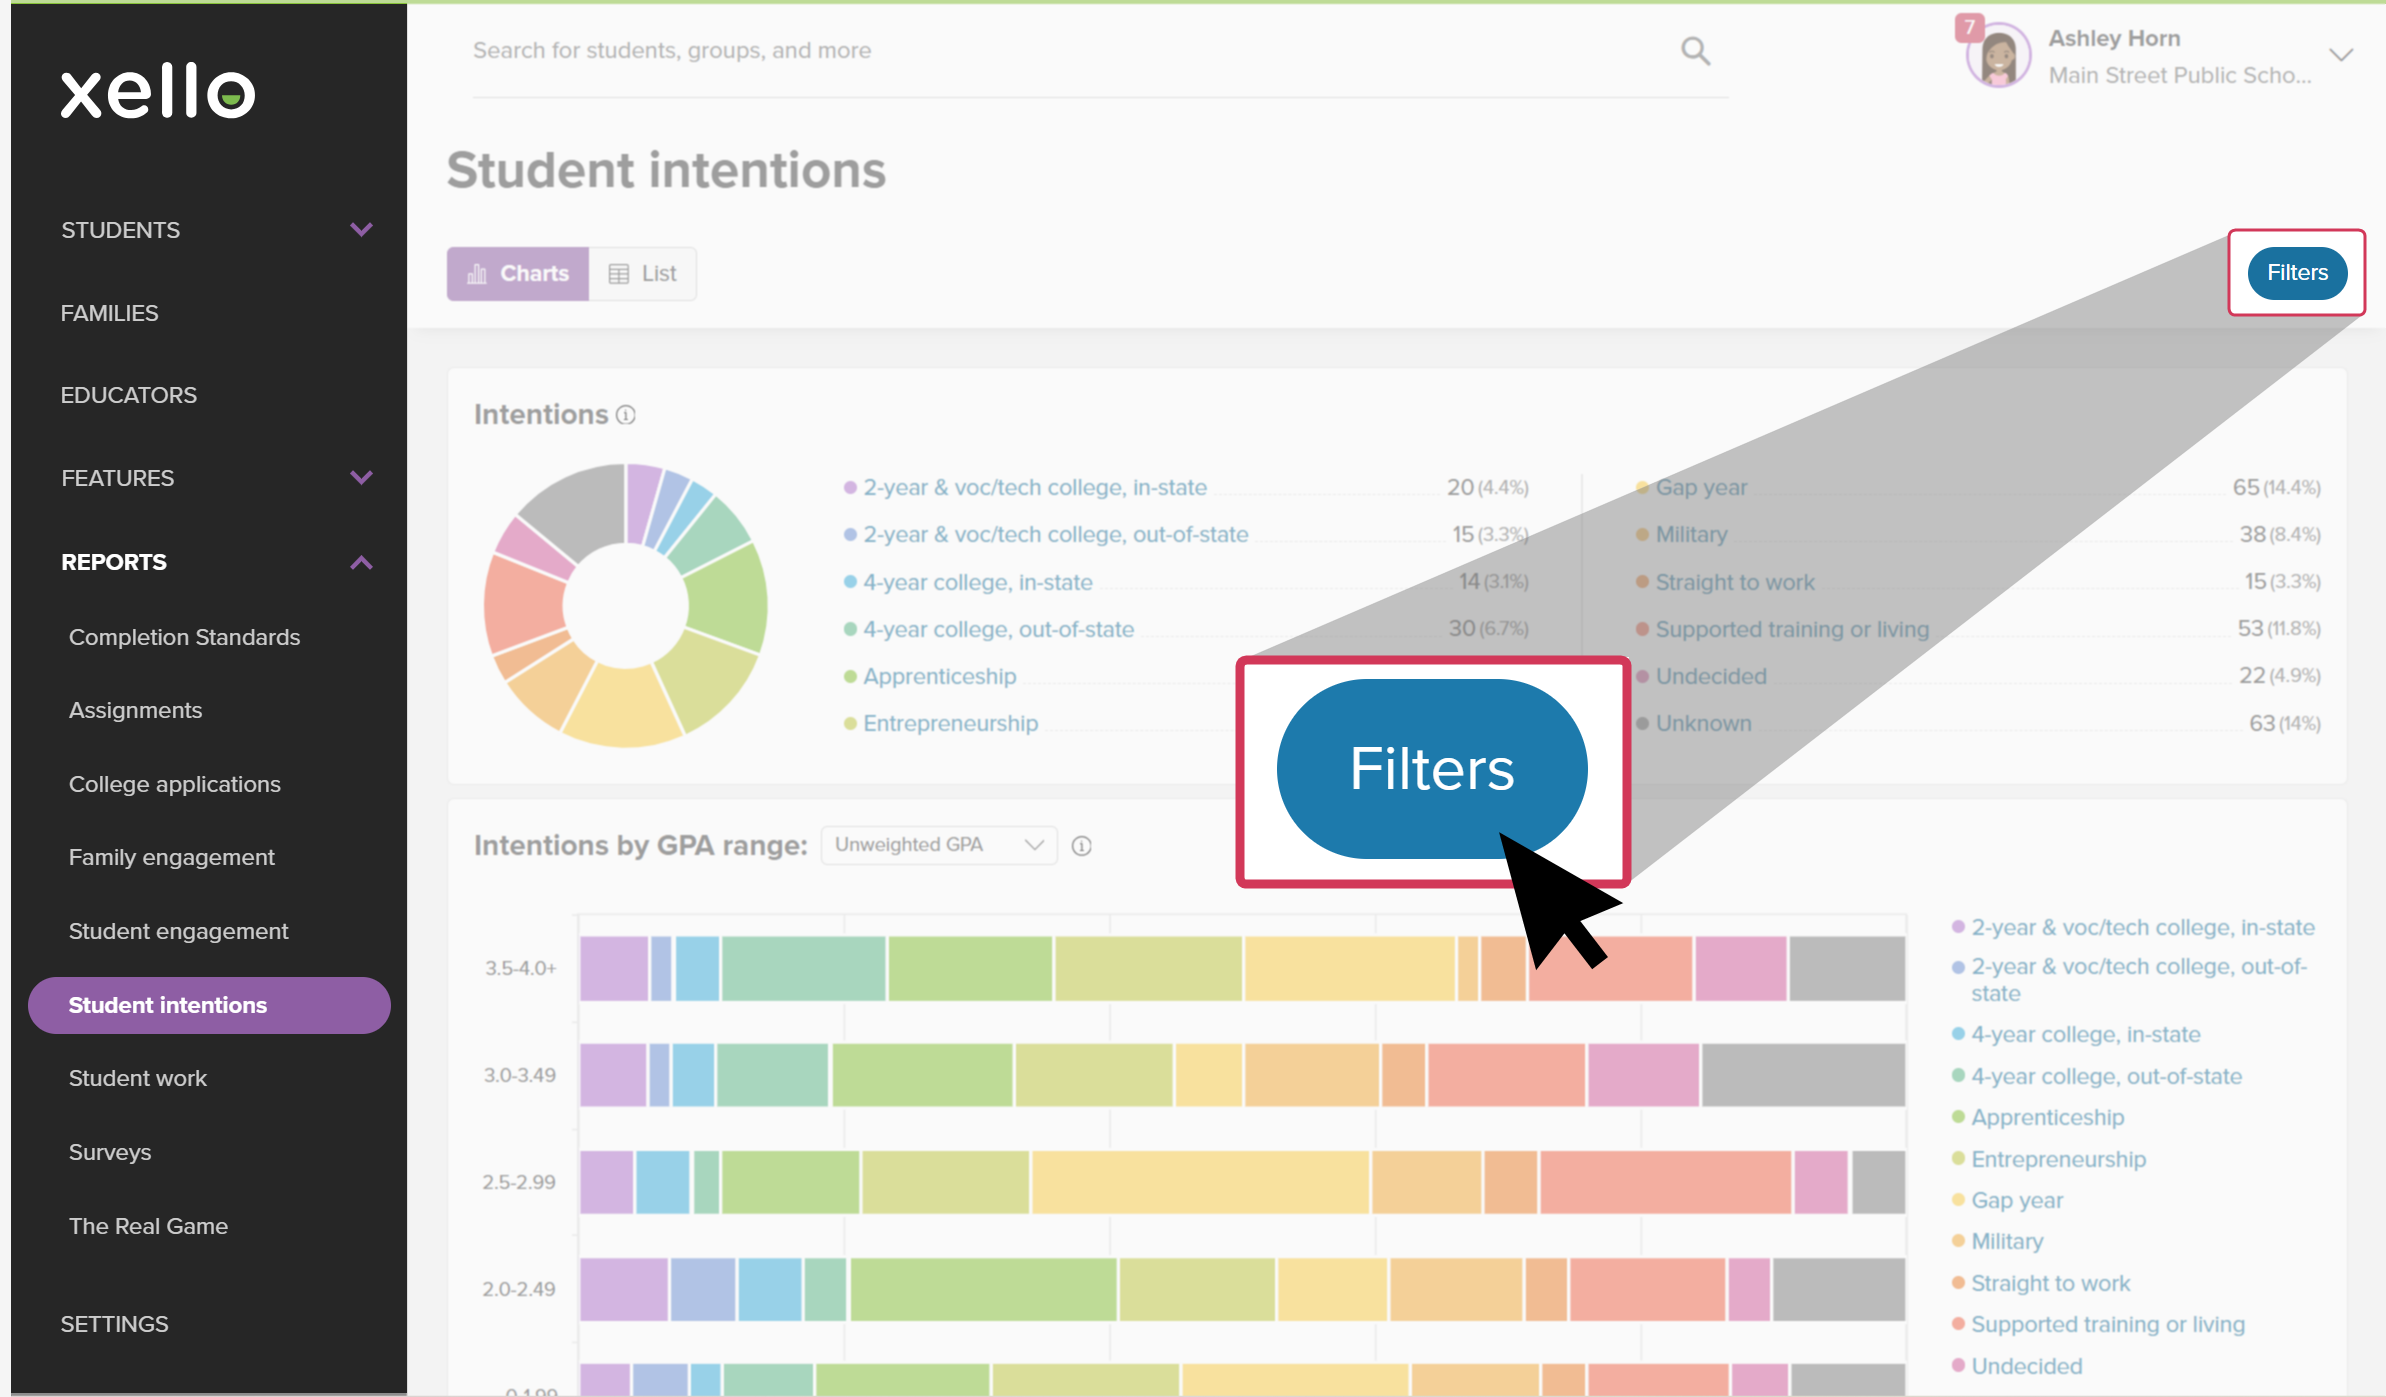
Charts view
When you first open the Student intentions report page, the default view is with the colorful Charts displaying postsecondary intentions, followed by saved options and top choices. These high-level views are ideal for quickly viewing trends and top-10 lists.
From each of the charts, you can click the label or chart segment to dig deeper into the data for that report. It will open a student list filtered to the data you clicked, so you can see which students fit into that segment.
For the "Top" lists (e.g. top 4-year colleges by submitted applications, top saved careers and clusters, etc), clicking the label will redirect you to existing reports where you can dive into the filtered student list. For example:
- Clicking a college in Top 4-year colleges by number of submitted applications will open the College application by institution report filtered to the students who have submitted an application to that school
- Clicking a career in the Saved careers list will open the Student work report filtered to students who saved that career.
To help drill down into the data, click Filters. Using the filters, you can narrow the data by grade, educator, group, or gender. These filters will persist as you click into the charts and lists, so you don't lose your context.

The available reports on the Charts view are:
| Chart | Data definition |
|---|---|
|
Intentions (by pathway) |
The data shows the distribution of students' intended post-secondary pathways, based on their primary plans in Xello. Available for grades 6-12 Undecided means the student has created a plan in Xello and marked their postsecondary intention as Undecided. Unknown means the student has not created a plan. If this report has not populated, encourage your students to create a plan in Xello. |
|
Intentions by GPA range: Weighted or unweighted GPA |
The data shows the distribution of students' intended post-secondary pathways by GPA range for each GPA type. This is based on students' primary plans in Xello. Available for grades 9-12 Undecided means the student has created a plan in Xello and marked their postsecondary intention as Undecided. Unknown means the student has not created a plan. If this report has not populated, encourage your students to create a plan in Xello and ensure their Test scores & GPA have been uploaded. |
|
College applications |
The data shows the number of students who have submitted at least one college application and those who have not submitted any. Available for grades 11-12 If this report has not populated, encourage your students to Track their college application including when they've submitted the application. To help students, educators can Add an application to a student's college application tracker. |
|
FAFSA completion |
The data shows how many students have FAFSA (and/or state aid) applications for each status. Available for grades 11-12 If this report has not populated, encourage your students to Track FAFSA and state aid applications. |
|
Acceptance rate of college students applied to |
The data shows the average GPAs of students who have submitted applications in each acceptance rate range. This is based on applications that have been submitted to 2-year, 4-year, and vocational/technical colleges. Available for grades 11-12 If this report has not populated, encourage your students to Track their college application including when they've submitted the application. Also, ensure their Test scores & GPA have been uploaded. |
|
Top 4-year colleges by number of submitted applications |
The data shows the most popular 4-year colleges based on the number of submitted applications. Available for grades 11-12 If this report has not populated, encourage your students to Track their college application including when they've submitted the application. |
|
Top 2-year & voc/tech colleges by number of submitted applications |
The data shows the most popular 2-year and vocational/technical colleges based on the number of submitted applications. Available for grades 11-12 If this report has not populated, encourage your students to Track their college application including when they've submitted the application. |
|
Saved options by type |
The data shows the number of students who have saved at least one career, college, and cluster and those who have not saved any. Available for grades 6-12 If this report has not populated, encourage your students to Explore options in Xello |
|
Saved careers Saved clusters Saved 4-year colleges Saved 2-year & voc/tech colleges |
The data shows the most popular careers/clusters/colleges based on the number of saves. Available for grades 6-12 If these reports have not populated, encourage your students to Explore options in Xello |
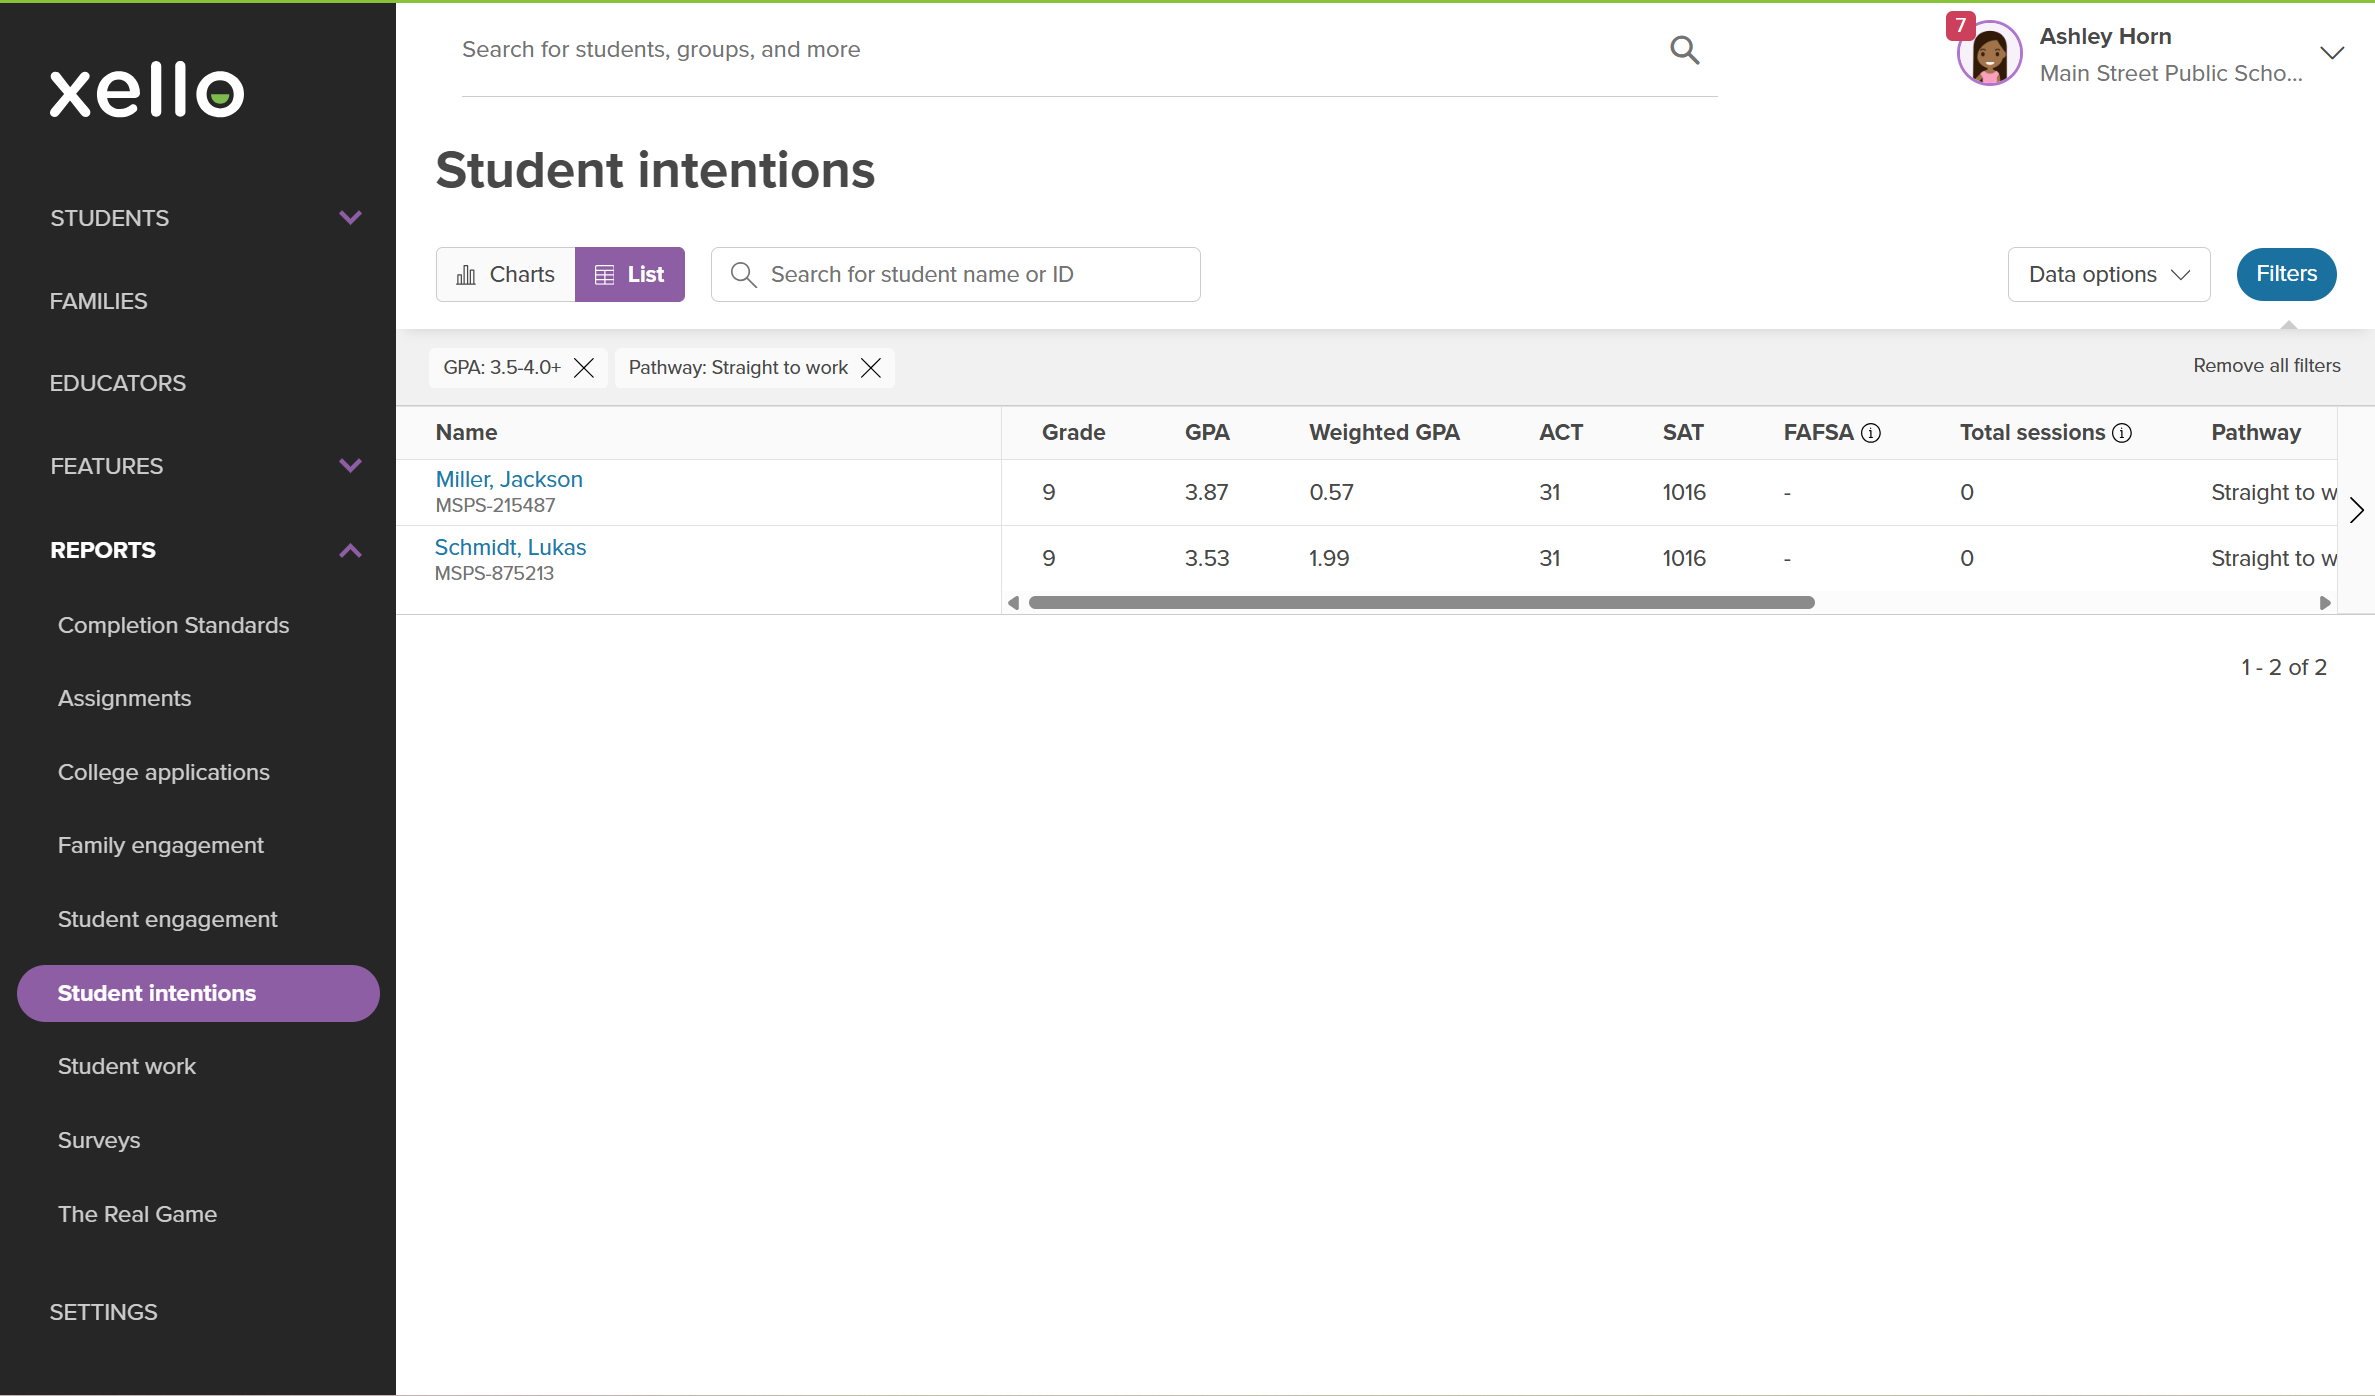
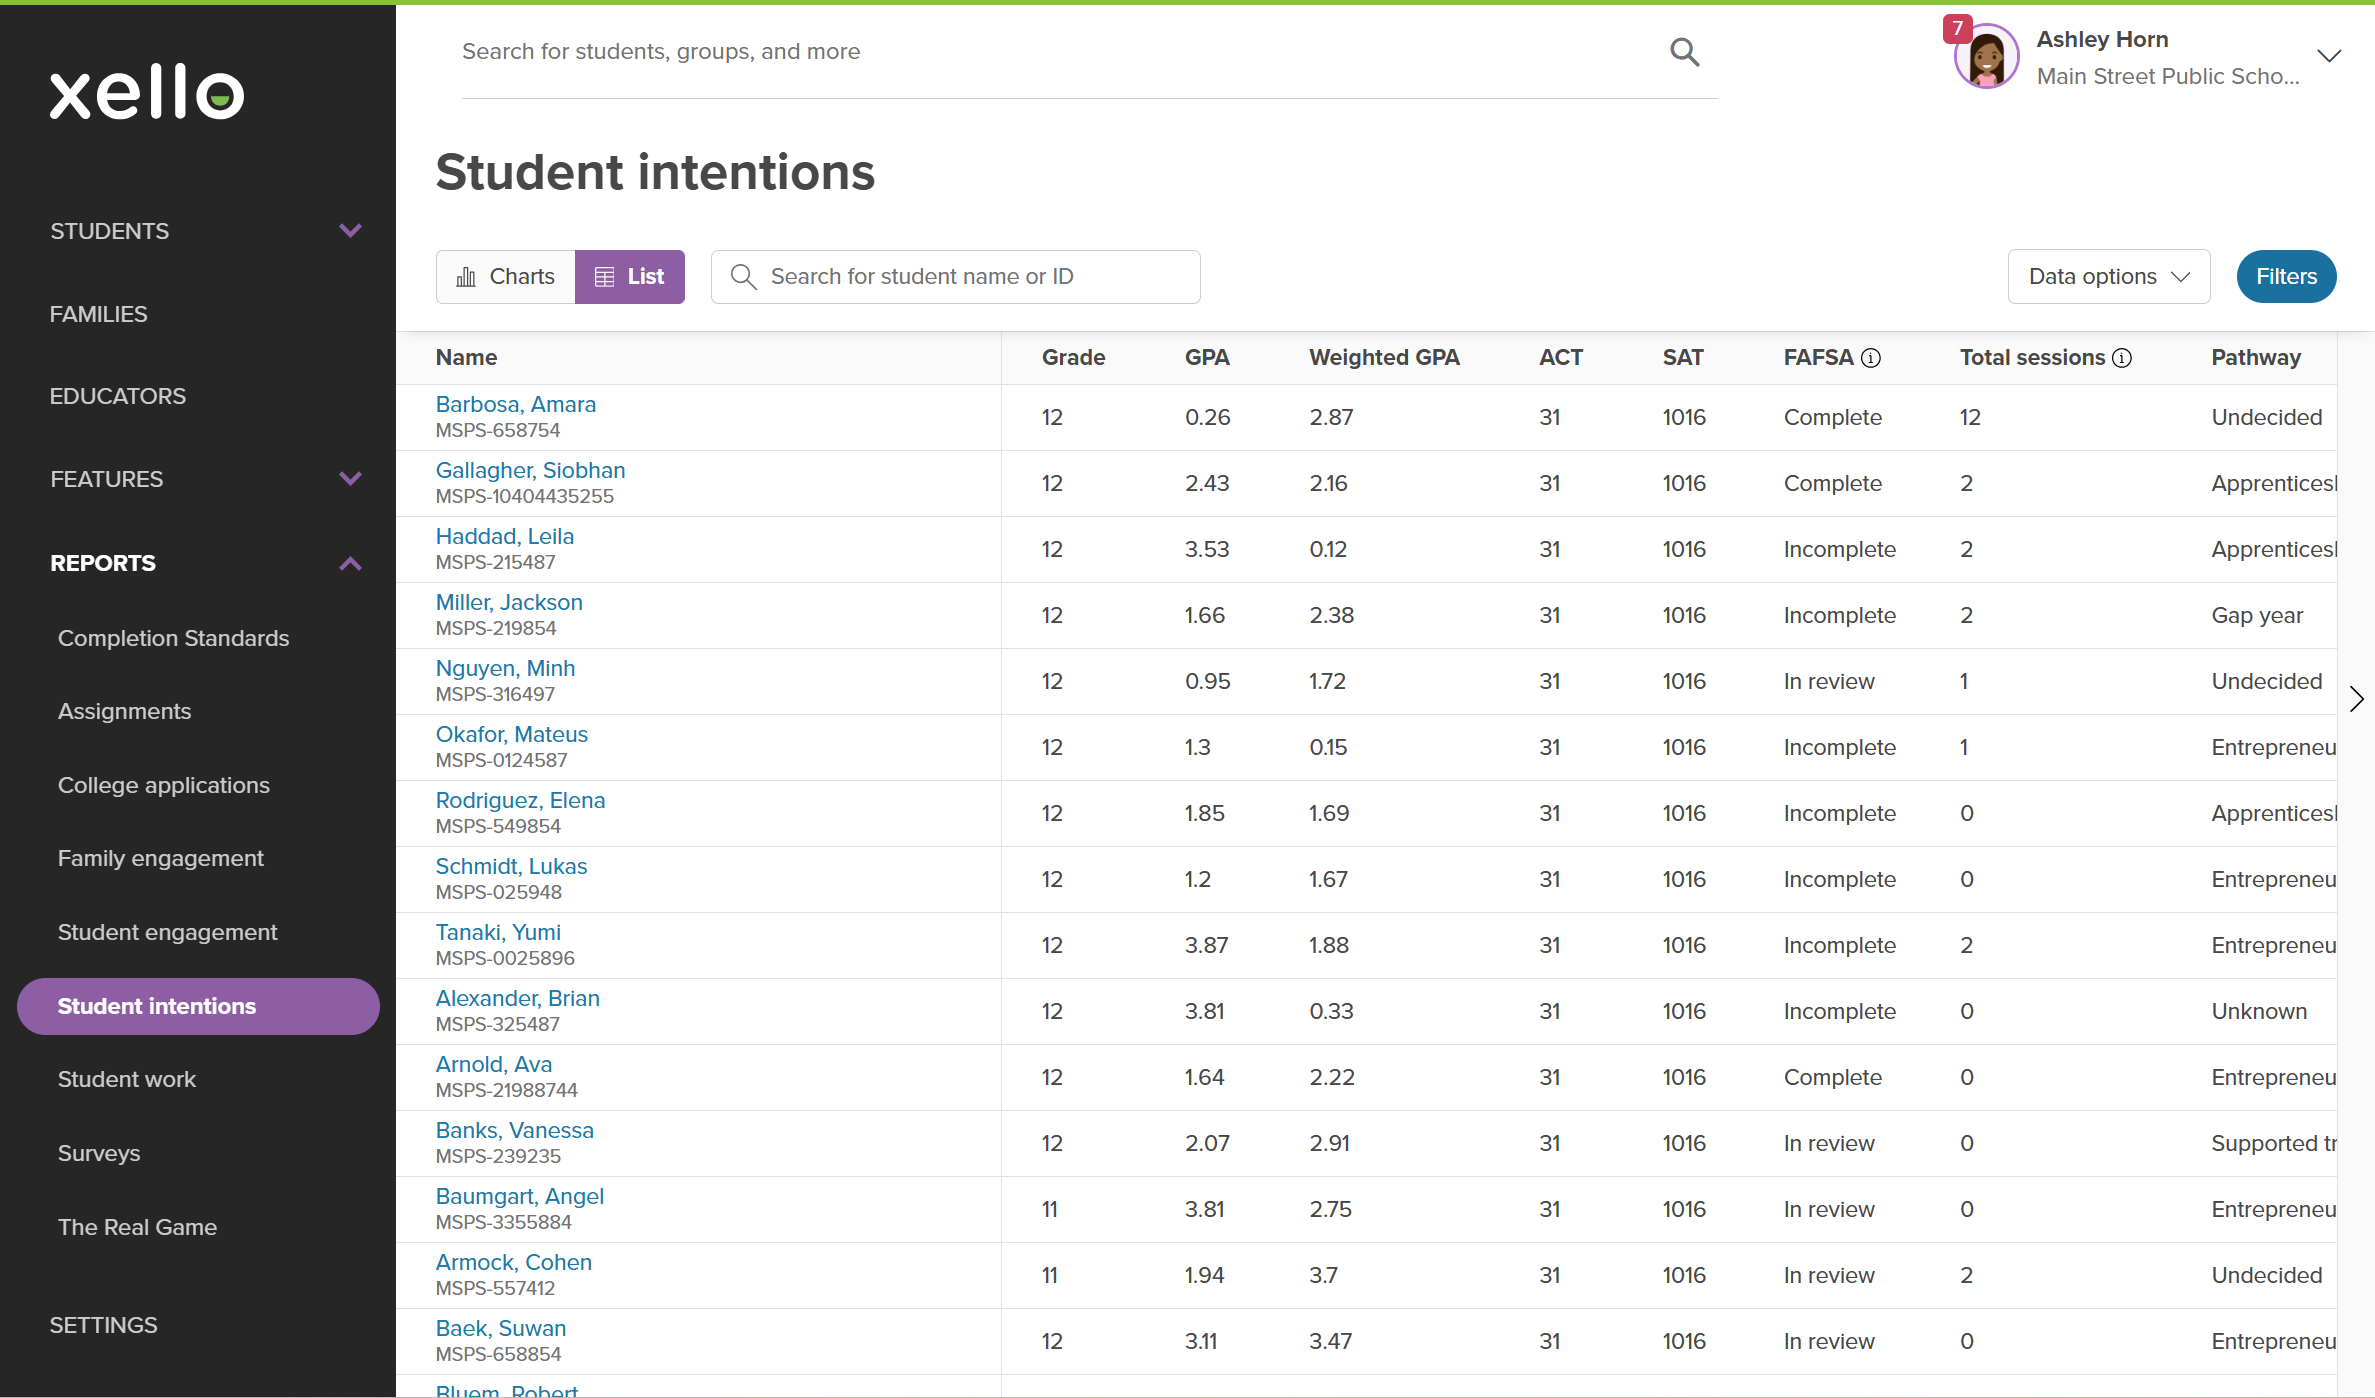
List view
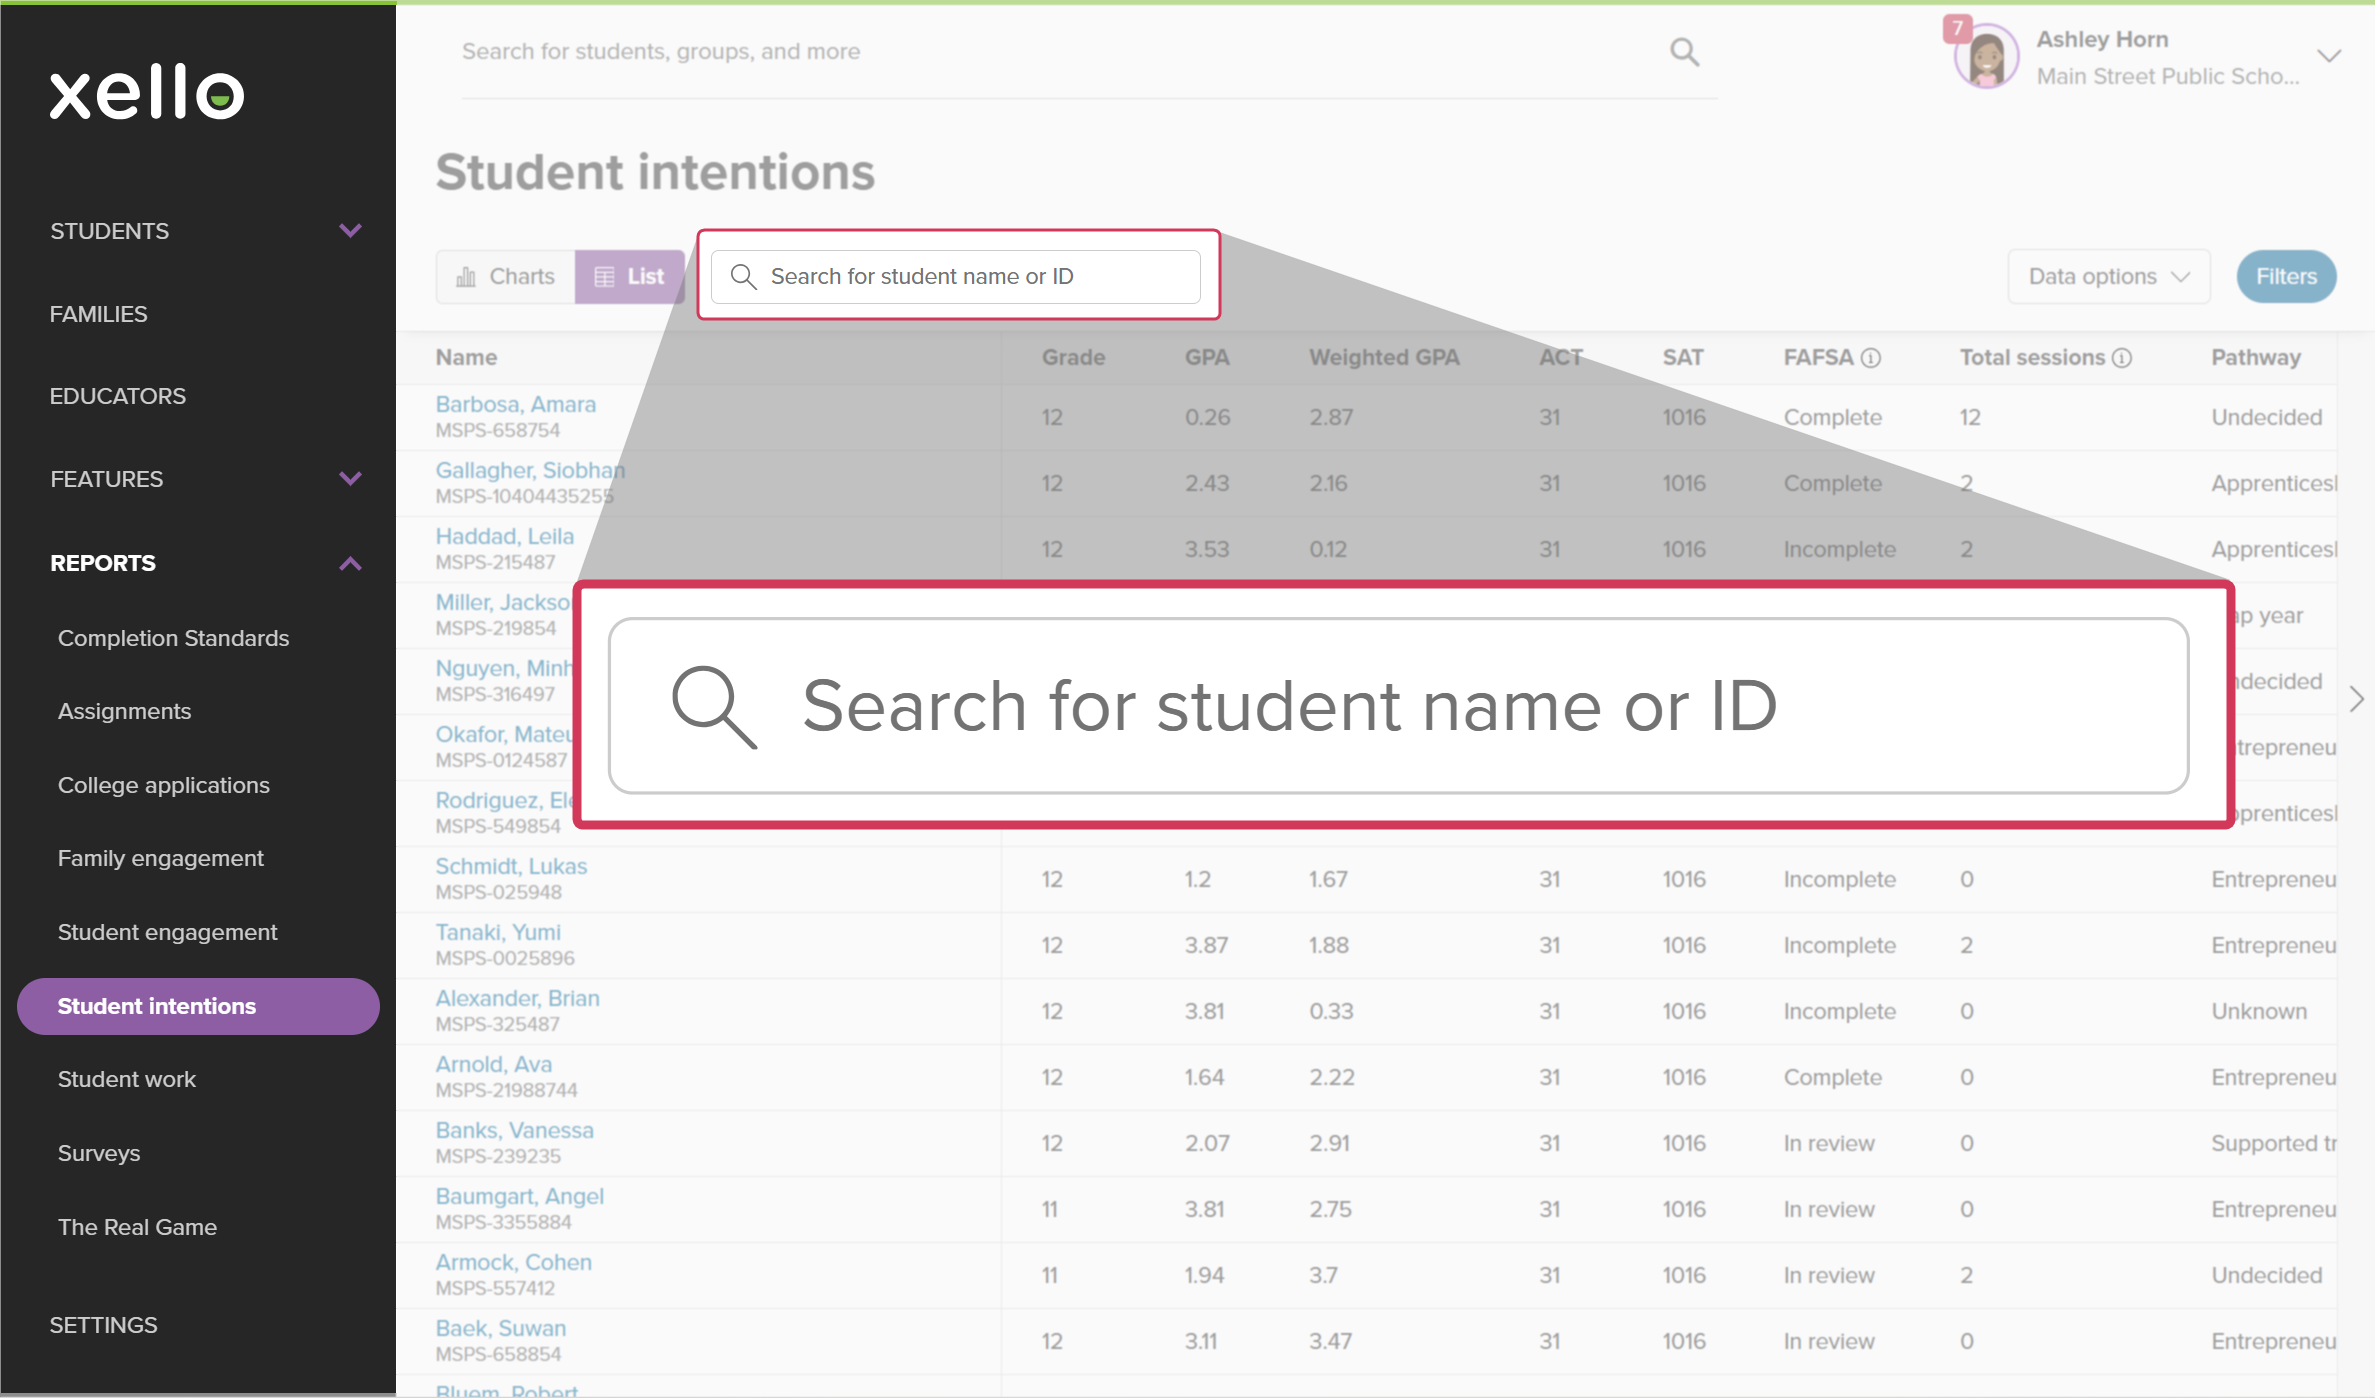
Viewing the Student intentions report using the List view allows you to drill down into the data by student. By default, the List view opens the full student list with key data such as grade, test scores and GPA, plan pathway and details, and college application submission and acceptance.
To help you narrow and utilize the broad range of data, you have several options:
- If you know the name of a specific student or their ID, you can use the search bar to find them.
 Click to enlarge
- Click Data options and select which table columns you'd like to have visible, then click Apply.
 Click to enlarge
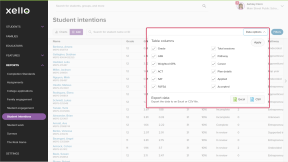
- Also from Data options, you can opt to export the data to an Excel or CSV file.
- Click Filters to narrow the student list by many options, such as grade, GPA range, test scores, specific pathways, whether they've applied or been accepted to a college, and more.
 Click to enlarge
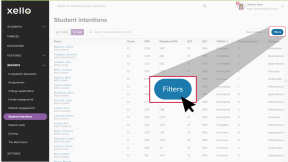
- Click the student name to open their student profile where you can view all their work across Xello.